 PQStat
 The Chi-square test for large tables
When to use this test:
The \(\chi^2\) test for \(r\times c\) tables, also known as Pearson's Chi-square test (Karl Pearson 1900), is used when we want to check whether two features with any number of categories (e.g. country of residence and education) are related. It is an extension of the \(\chi^2\) (goodness-of-fit) test to two features.
Assumptions
- measurement on a nominal scale,
- an independent model,
- large expected frequencies according to the Cochran interpretation (1952)[42].
How to set up the analysis
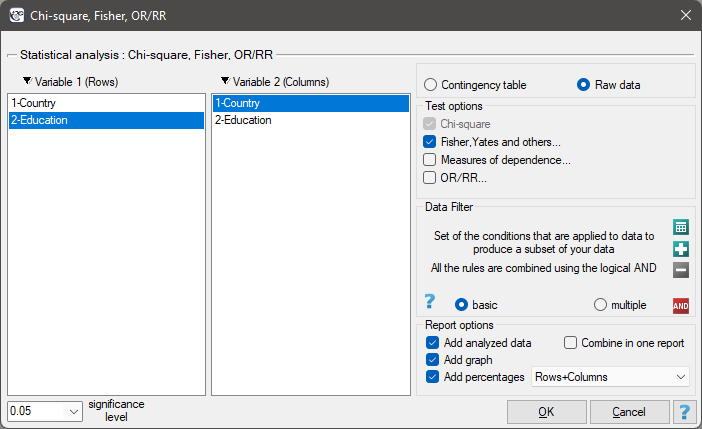
Statistics \(\to\) NonParametric tests \(\to\) Chi-square, Fisher, OR/RR (or via the Wizard).
Performance and interpretation
Example 1. (country-education.pqs file)
There is a sample of 605 people (\(n=605\)), for whom 2 features are analysed (\(X\)=country of residence, \(Y\)=education). The first feature occurs in 4 categories, and the second in 3 categories (\(X_1\)=Country 1, \(X_2\)=Country 2, \(X_3\)=Country 3, \(X_4\)=Country 4, \(Y_1\)=primary, \(Y_2\)=secondary, \(Y_3\)=higher). The data distribution is shown in the contingency table below:
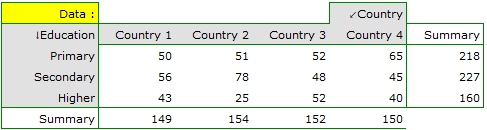
Based on this sample, we would like to find out whether there is a dependence between education and country of residence in the analysed population.
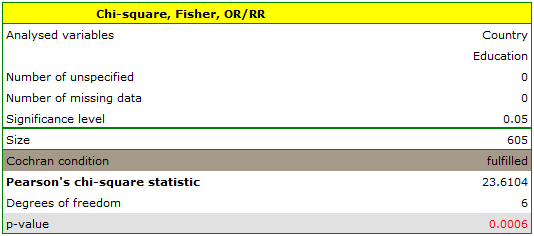
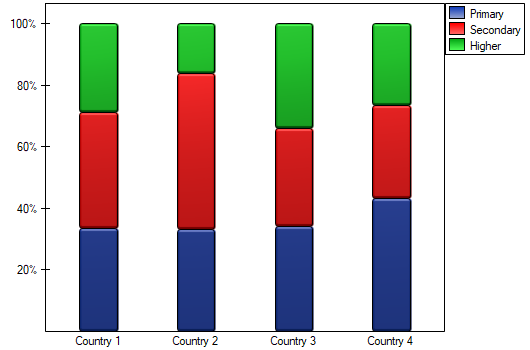
Cochran's condition is satisfied. If we are interested in more precise information about the detected dependence, we can obtain it by determining multiple comparisons through the Fisher, Yates and others... option, then Multiple column comparisons (RxC) and one of the corrections, e.g. Benjamini-Hochberg.
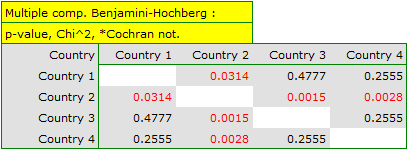
A closer look reveals that only the second country differs from the other countries in educational attainment in a statistically significant way.
Hypotheses:
Formulas: The test statistic is defined by:
This statistic asymptotically (for large expected frequencies) has the \(\chi^2\) distribution with a number of degrees of freedom calculated using the formula: \(df=(r-1)(c-1)\).