 PQStat
The ANOVA for independent groups with \(F^*\) and \(F''\) corrections
When to use this test:
The \(F^*\) (Brown-Forsythe, 1974[34]) and \(F''\) (Welch, 1951[172]) corrections are variants of the ANOVA for independent groups, used when the variances of the analysed variable differ significantly between the compared populations. The purpose of the test is the same as for the basic variant – only the way of calculating the test statistic and degrees of freedom differs (see For those interested).
Assumptions
- measurement on an interval scale,
- normality of distribution of the analysed variable in each population,
- an independent model,
- significantly different variances of the analysed variable between populations (otherwise use the ANOVA for independent groups without correction).
How to set up the analysis
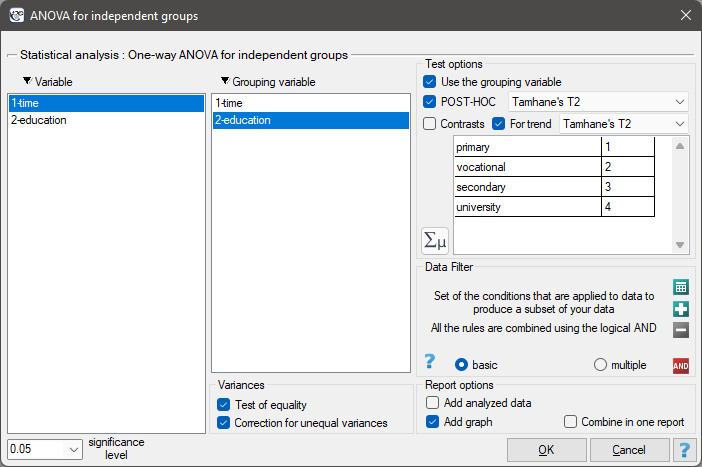
Statistics \(\to\) Parametric tests \(\to\) ANOVA for independent groups (or via the Wizard).
Performing and interpreting the analysis
Example 1. (unemployment.pqs file)
There are many factors that affect how long it takes to find a job during an economic crisis. One of the most important may be the level of education. Sample data on education and time (in months) spent unemployed are gathered in the file. We want to check whether there are differences in average job-search time between education categories.
Due to differences in variance between the populations (for Levene's test \(p=0.0001\), and for the Brown-Forsythe test \(p=0.0002\)):
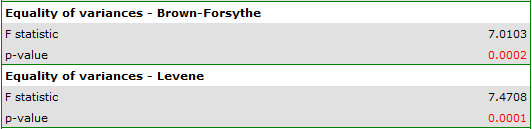
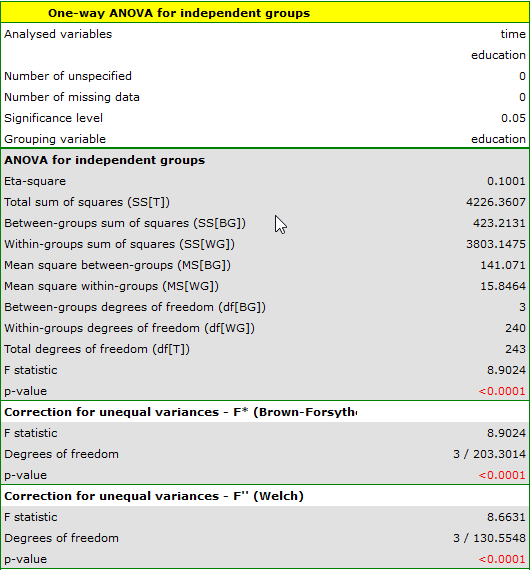
the analysis is performed with the correction for unequal variances enabled. The resulting adjusted \(F\) statistic is shown below.
By performing one of the POST-HOC tests dedicated to comparing groups with unequal variances (see For those interested), we find out which education categories the differences apply to:
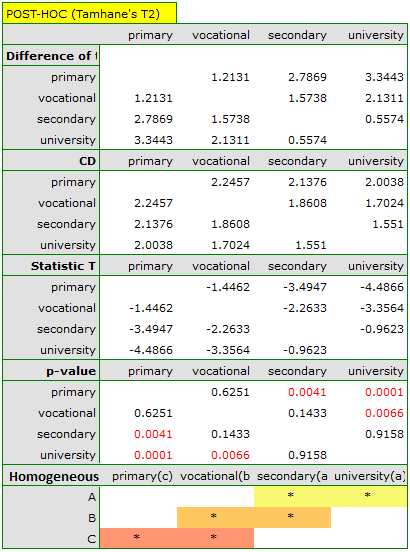
The critical difference (CD) determined for each pair of comparisons is not the same (even though the group sizes are equal), because the variances are not equal. Relating the CD value to the resulting differences in mean values gives the same result as comparing the \(p\) value with the significance level \(\alpha=0.05\). The differences concern primary and higher education, primary and secondary education, and vocational and higher education. The resulting homogeneous groups overlap. Overall, however, looking at the graph, we can expect that the more educated a person is, the less time it takes them to find a job.
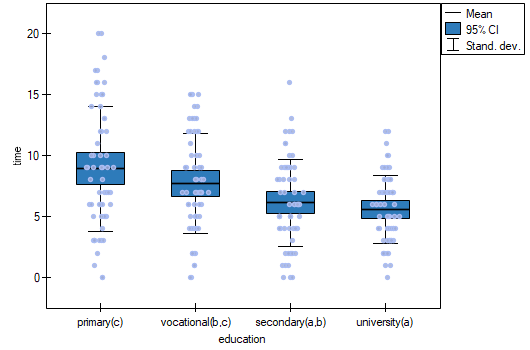
To test this hypothesis, we perform a trend analysis. To do this, we resume the analysis with the  button and, in the test options window, select the Tamhane's T2 method together with the For trend option, indicating the order of the education categories with consecutive natural numbers.
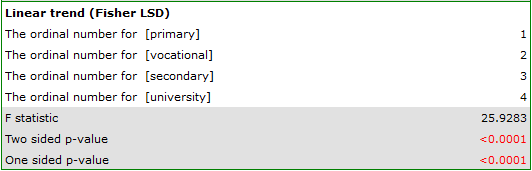
Depending on whether the direction of the relationship between education and job-search time is known to us, we use the one-sided or two-sided \(p\) value. Both of these values are smaller than the assumed significance level – the trend we expected is confirmed, i.e. at the significance level \(\alpha=0.05\) we can say that this trend really does exist in the population from which the sample was drawn.
Hypotheses:
Formulas: the test statistic is defined by:
where:
\(sd_j\) – standard deviation of group \(j\),
\(w_j=\frac{n_j}{sd_j^2}\) – weight of group \(j\),
\(\widetilde{x}\) – weighted mean,
\(h_j=\frac{\left(1-\frac{w_j}{\sum_{j=1}^kw_j}\right)^2}{n_j-1}\).
The test statistic has the F Snedecor distribution with \(k-1\) and adjusted \(df_{WG_k}\) degrees of freedom.
The \(p\) value, determined on the basis of the test statistic, is compared with the significance level \(\alpha\): if \(p \le \alpha\), we reject \(\mathcal{H}_0\) in favor of \(\mathcal{H}_1\); if \(p > \alpha\), there is no reason to reject \(\mathcal{H}_0\).
POST-HOC tests
An introduction to contrasts and POST-HOC tests is provided in section Contrasts and POST-HOC tests, which concerns the one-way analysis of variance. The methods below, unlike the LSD Fisher, Scheffe and Tukey tests, are used when the variances of the analysed variable differ significantly.
The T2 Tamhane test
For simple and complex comparisons, equal-size groups as well as unequal-size groups (Tamhane A. C., 1977[160]).
- \(\mathfrak{(i)}\)
The critical difference is calculated using the formula:
\[ CD=\sqrt{F_{\alpha_{Sidak},1,df_v}}\cdot \sqrt{\left(\sum_{j=1}^k \frac{c_j^2sd_j^2}{n_j}\right)}, \]where \(F_{\alpha_{Sidak},1,df_v}\) is the critical value (statistic) of the F Snedecor distribution for the modified significance level \(\alpha_{Sidak}\) and for degrees of freedom 1 and \(df_{v}\), respectively,
\(\alpha_{Sidak}=1-(1-\alpha)^{(1/k)}\),
\(df_v=\frac{\left(\sum_{j=1}^k\frac{c_j^2sd_j^2}{n_j}\right)^2}{\sum_{j=1}^k\frac{c_j^4sd_j^4}{n_j^2(n_j-1)}}\) - \(\mathfrak{(ii)}\)
The test statistic is defined by:
\[ t=\frac{\left(\sum_{j=1}^k c_j\overline{x}_j\right)^2}{\sqrt{\left(\sum_{j=1}^k \frac{c_j^2sd_j^2}{n_j}\right)}}. \]The test statistic has the \(t\)-Student distribution with \(df_v\) degrees of freedom, and the \(p\) value is adjusted for the number of possible simple comparisons.
The BF test (Brown-Forsythe)
For simple comparisons, equal-size groups as well as unequal-size groups (Brown M. B. and Forsythe A. B., 1974[33]).
- \(\mathfrak{(i)}\)
The critical difference is calculated using the formula:
\[ CD=\sqrt{F_{\alpha,k-1,df_v}}\cdot \sqrt{(k-1)\left(\sum_{j=1}^k \frac{c_j^2sd_j^2}{n_j}\right)}, \]where \(F_{\alpha,k-1,df_v}\) is the critical value (statistic) of the F Snedecor distribution for a given significance level \(\alpha\) and \(k-1\) and \(df_v\) degrees of freedom.
- \(\mathfrak{(ii)}\)
The test statistic is defined by:
\[ F=\frac{\left(\sum_{j=1}^k c_j\overline{x}_j\right)^2}{(k-1)\left(\sum_{j=1}^k \frac{c_j^2sd_j^2}{n_j}\right)}. \]The test statistic has the F Snedecor distribution with \(k-1\) and \(df_v\) degrees of freedom.
The GH test (Games-Howell)
For simple comparisons, equal-size groups as well as unequal-size groups (Games P. A. and Howell J. F., 1976[69]).
- \(\mathfrak{(i)}\)
The critical difference is calculated using the formula:
\[ CD=\frac{q_{\alpha,k,df_v} \cdot \sqrt{\left(\sum_{j=1}^k \frac{c_j^2sd_j^2}{n_j}\right)}}{\sqrt{2}}, \]where \(q_{\alpha,k,df_v}\) is the critical value (statistic) of the studentized range distribution for a given significance level \(\alpha\) and \(k\) and \(df_v\) degrees of freedom.
- \(\mathfrak{(ii)}\)
The test statistic is defined by:
\[ q=\sqrt{2}\frac{\sum_{j=1}^k c_j\overline{x}_j}{\sqrt{\left(\sum_{j=1}^k \frac{c_j^2sd_j^2}{n_j}\right)}}. \]The test statistic has the studentized range distribution with \(k\) and \(df_v\) degrees of freedom.
Test for trend
The test examining the existence of a trend can be calculated in the same situation as the ANOVA for independent groups with \(F^*\) and \(F''\) corrections, since it is based on the same assumptions, but it captures the alternative hypothesis differently – indicating the existence of a trend in the mean values across successive populations. The analysis of the trend in the arrangement of means is based on T2 Tamhane contrasts. A table of sample contrast values for selected trends can be found in the description of the test for trend for the ANOVA without correction for unequal variances.
A linear trend is analyzed based on the linear contrast, assigning appropriate contrast values to the groups ordered naturally and calculating the T2 Tamhane statistic. With the expected direction of the trend known, the alternative hypothesis is one-sided and the one-sided \(p\) value is interpreted; interpreting the two-sided \(p\) value means that the researcher does not know (does not assume) the direction of the possible trend. The determined \(p\) value is compared with \(\alpha\): if \(p \le \alpha\), we reject \(\mathcal{H}_0\) in favor of \(\mathcal{H}_1\); if \(p > \alpha\), there is no reason to reject \(\mathcal{H}_0\).