 PQStat
The Wilcoxon test (matched-pairs)
When to use this test:
The Wilcoxon matched-pairs test is used when the same characteristic is measured twice for the same subjects, under different conditions (e.g. before and after treatment), and the data do not meet the assumptions of the \(t\)-test for dependent groups (e.g. they are not normally distributed). It checks whether the measurement changed.
The test is also called the Wilcoxon test for dependent groups (Wilcoxon 1945[?], 1949[?]) – it is the extension for two dependent samples of the Wilcoxon test (signed-ranks), designed for one sample.
Assumptions
- measurement on an ordinal scale or an interval scale,
- a dependent model.
How to set up the analysis
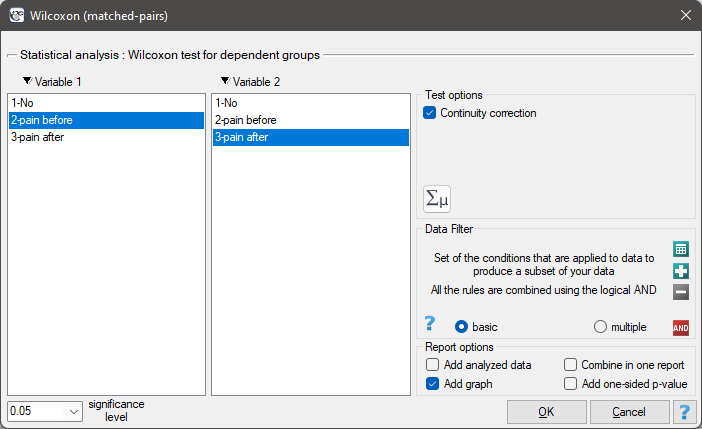
Statistics \(\to\) NonParametric tests \(\to\) Wilcoxon (matched-pairs) (or via the Wizard).
Performance and interpretation
Example 1. (pain.pqs file)
A sample of 22 patients suffering from cancer was drawn. They were examined to check their level of felt pain (1–10 scale, where 1 means no pain and 10 means the greatest pain). This examination was repeated after a month of treatment with a new medicine, meant to lower the level of felt pain. The following results were obtained: (pain before, pain after): (2, 2) (2, 3) (3, 1) (3,1) (3, 2) (3, 2) (3, 3) (4, 1) (4, 3) (4, 4) (5, 1) (5, 1) (5, 2) (5, 4) (5, 4) (6, 1) (6, 3) (7, 2) (7, 4) (7, 4) (8, 1) (8, 3). We want to check whether the treatment had an effect on the level of felt pain in the population from which the sample was drawn.
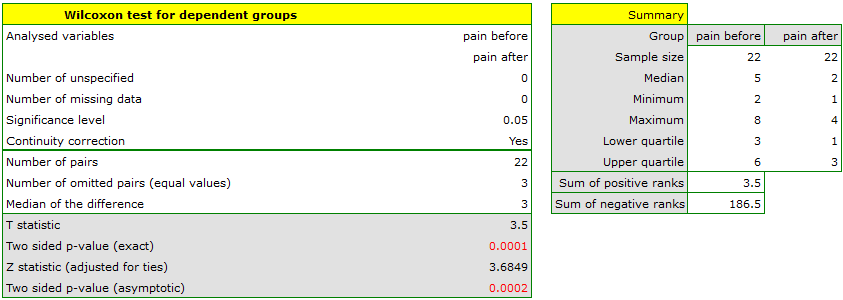
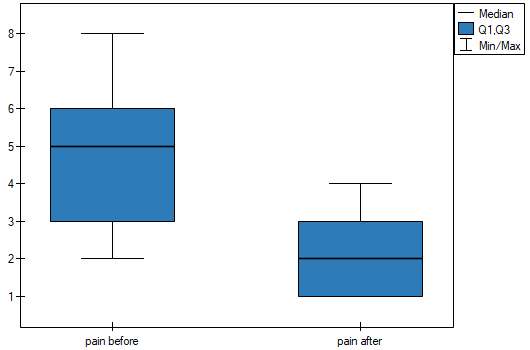
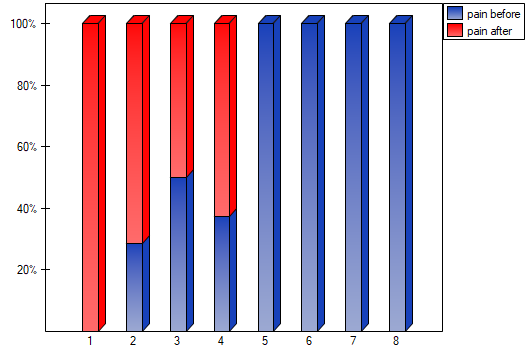
The \(p\) value, calculated on the basis of the test statistic, is always compared with the assumed significance level \(\alpha\): when \(p \le \alpha\), the change is statistically significant; when \(p > \alpha\), there is no reason to claim that a change occurred. The same decision would be reached on the basis of \(p=0.00021\) or \(p=0.000229\) of the Wilcoxon test based on the \(Z\) statistic (without and with the continuity correction, respectively). The difference can be seen in a box-and-whisker plot or a column plot. It is also worth reporting the effect size (Cohen's d) – statistical significance alone does not indicate how large the change is.
Definitions of measures
r (effect size) – a measure of effect strength based on a transformation of the test statistic \(Z\); it ranges from 0 (no effect) to 1 (maximum effect).
Cohen's d – a standardized effect-size measure, calculated here from \(r\) following the standard conversion used in meta-analyses. It makes it possible to assess the practical significance of a difference regardless of sample size.
Hypotheses: concern the equality of the sums of positive and negative ranks, or are simplified to medians:
\(\begin{array}{cl} \mathcal{H}_0: & \theta_0=0, \\ \mathcal{H}_1: & \theta_0\neq 0, \end{array}\)
where \(\theta_0\) – median of the differences \(d_i\) in a population.
Formulas: depending on the sample size, the test statistic is calculated using different formulas. For a small sample size:
where \(\sum R_+\) – sum of positive ranks, \(\sum R_-\) – sum of negative ranks. This statistic has the Wilcoxon distribution and does not contain any correction for ties. For a large sample size:
where \(n\) – number of ranked signs (number of ranks), \(t\) – number of cases included in a tie. The formula for the \(Z\) statistic includes the correction for ties, used when ties occur (if there are none, the correction is not calculated, since \(\frac{\sum t^3-\sum t}{48}=0\)). The \(Z\) statistic asymptotically (for large sample sizes) has the normal distribution. The Wilcoxon test with the continuity correction (Marascuilo and McSweeney (1977)[117]) – used to guarantee that the test statistic can take all real-number values, in line with the normal-distribution assumption:
\(r\) is calculated using the formula \(r=\left|Z/n\right|\) [68], and Cohen's d:
When interpreting an effect, researchers often use general guidelines proposed by Cohen [47] defining small (0.2), medium (0.5) and large (0.8) effect sizes.