 PQStat
The Page test for trend
When to use this test:
The Page test for ordered alternatives, described in 1963 by Page[133], can be performed in the same situation as the Friedman ANOVA, since it is based on the same assumptions. Unlike the Friedman ANOVA, however, it does not check for arbitrary differences between measurements, but whether the medians of successive measurements increase or decrease in the expected direction.
Assumptions
- measurement on an ordinal scale or an interval scale,
- a dependent model,
- a known or assumed order of the measurements.
How to set up the analysis
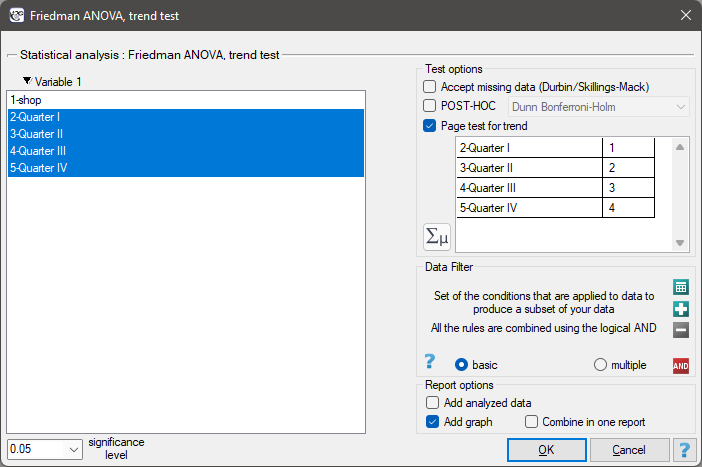
Statistics \(\to\) Nonparametric tests \(\to\) Friedman ANOVA (missing data allowed) (or via the Wizard).
Performing and interpreting the analysis
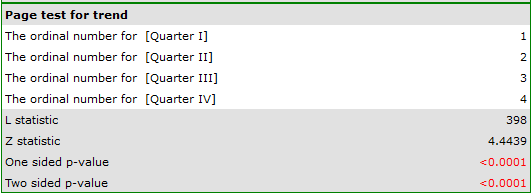
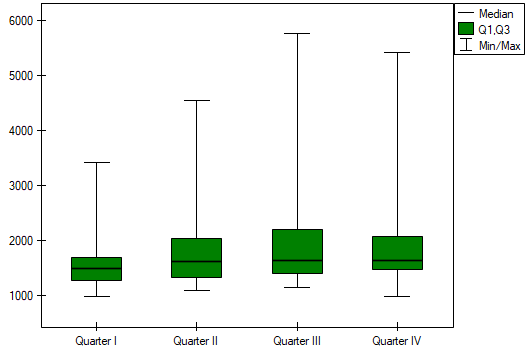
Continuation of Example 1 (chocolate bar.pqs file): the expected result of the intensive advertising campaign conducted by the company is a steady increase in sales of the advertised bar. We will therefore check whether sales of the bar change in the expected direction across successive quarters.
Hypotheses: relate to the equality of the sum of ranks for successive measurements or are simplified to medians:
Formulas: the test statistic is defined by:
where:
\(L=\sum_{j=1}^kR_jc_j\),
\(R_j\) – sum of ranks of the \(j\)-th measurement,
\(c_j\) – weight for the \(j\)-th measurement, indicating the natural order of this measurement among the others (the weights are consecutive natural numbers).
Comment: the formula for the test statistic \(Z\) does not include a correction for tied ranks, which makes it somewhat more conservative when tied ranks are present. Using a correction for tied ranks is, however, not recommended for this test. The \(Z\) statistic asymptotically (for large sample sizes) has the normal distribution.
Interpretation: with the expected direction of the trend known, the alternative hypothesis is one-sided and the one-sided \(p\) value is interpreted. Interpreting the two-sided \(p\) value means that the researcher does not know (does not assume) the direction of the possible trend.
The \(p\) value, determined on the basis of the test statistic, is compared with \(\alpha\): if \(p \le \alpha\), we reject \(\mathcal{H}_0\) in favor of \(\mathcal{H}_1\); if \(p > \alpha\), there is no reason to reject \(\mathcal{H}_0\).