 PQStat
The Chi-square test for trend
When to use this test:
The \(\chi^2\) test for trend, also called the Cochran-Armitage trend test (ang. Cochran-Armitage test for trend)[43][10], is used when we have ordered categories of one feature (e.g. education level) and two groups of the other feature (e.g. smoker/non-smoker), and we want to check whether the proportions across the ordered categories increase or decrease in a systematic way – i.e. whether a trend is visible.
Assumptions
- measurement on an ordinal scale or an interval scale (the categories must be orderable),
- an independent model (the second feature – 2 independent groups).
How to set up the analysis
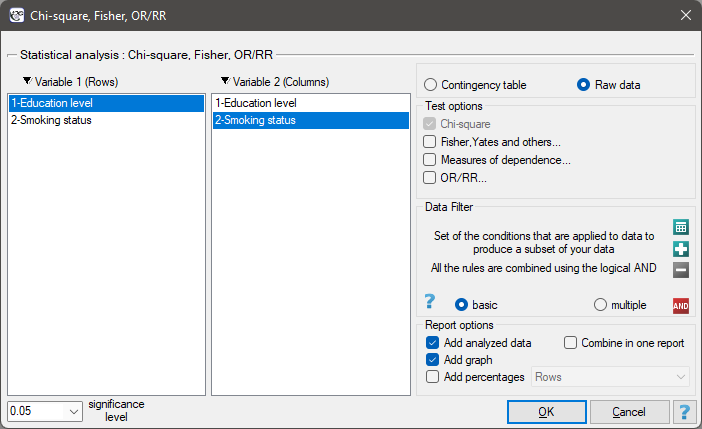
Statistics \(\to\) NonParametric tests \(\to\) Chi-square, Fisher, OR/RR, option Fisher, Yates and others... \(\to\) Chi-square for trend.
Performance and interpretation
Example 1. (smoking-education.pqs file)
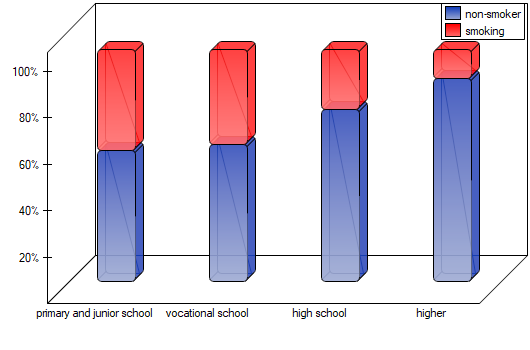
We check whether cigarette smoking is related to the education of residents of a village. A sample of 122 people was drawn. We assume that the relationship can be of two types: the more educated people are, the more often they smoke, or the more educated people are, the less often they smoke – so we are looking for an increasing or decreasing trend.
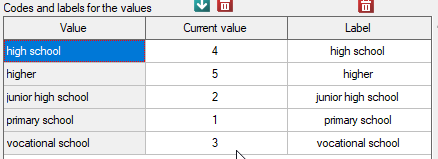

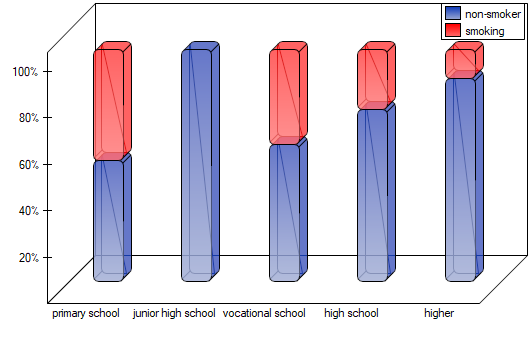
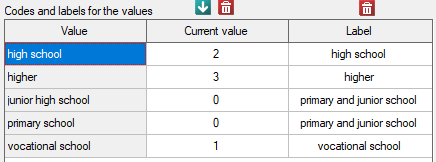
As the graph shows, the more educated people are, the less often they smoke. However, the result obtained for people with lower secondary education deviates from this trend – since this category has only two people, it did not have much effect on the overall trend. Due to the very small size of this group, the analysis was repeated for the combined primary and lower secondary education categories.
Example 2. (viewers.pqs file)
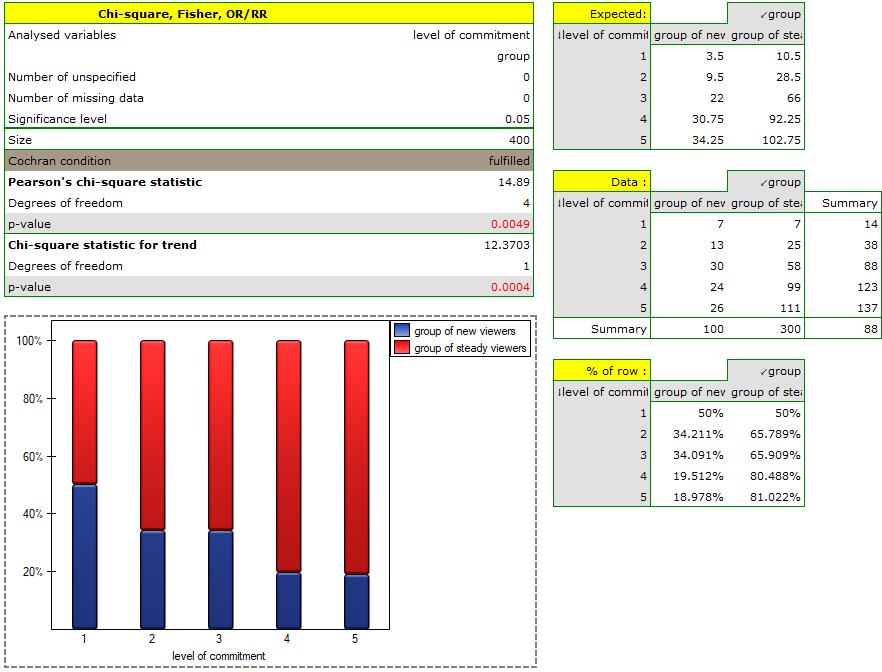
Because of a decrease in the audience of a particular soap opera, a viewer opinion survey was carried out. 100 people who had recently started watching the soap opera and 300 who had watched it regularly from the beginning were surveyed. Among other things, they were asked to rate their level of preoccupation with the characters' fate. The results are shown in the table below:
| Level of | group | ||
| commitment | group of new viewers | group of steady viewers | total |
| rather small | 7 | 7 | 14 |
| average | 13 | 25 | 38 |
| rather high | 30 | 58 | 88 |
| high | 24 | 99 | 123 |
| very high | 26 | 111 | 137 |
| total | 100 | 300 | 400 |
The new viewers make up 25% of all analysed viewers. This proportion is not the same for every level of commitment, however – it looks as follows:
| Level of | group | ||
| commitment | group of new viewers | group of steady viewers | total |
| rather small | \(p_1\)=50.00% | 50.00% | 100% |
| average | \(p_2\)=34.21% | 65.79% | 100% |
| rather high | \(p_3\)=34.09% | 65.91% | 100% |
| high | \(p_4\)=19.51% | 80.49% | 100% |
| very high | \(p_5\)=18.98% | 81.02% | 100% |
| total | 25.00% | 75.00% | 100% |
Notation: the \(r\times 2\) contingency table of observed frequencies:
| Observed frequencies | Feature 2 (group) | |||
| \(O_{ij}\) | \(G_1\) | \(G_2\) | Total | |
| Feature 1 (feature \(X\)) | \(X_1\) | \(O_{11}\) | \(O_{12}\) | \(W_1=O_{11}+O_{12}\) |
| \(X_2\) | \(O_{21}\) | \(O_{22}\) | \(W_2=O_{21}+O_{22}\) | |
| ... | ... | ... | ... | |
| \(X_r\) | \(O_{r1}\) | \(O_{r2}\) | \(W_r=O_{r1}+O_{r2}\) | |
| Total | \(C_1=\sum_{i=1}^rO_{i1}\) | \(C_2=\sum_{i=1}^rO_{i2}\) | \(n=C_1+C_2\) | |
Let \(p_1, p_2, ..., p_r\) denote the proportions \(p_1=\frac{O_{11}}{W_1}\), \(p_2=\frac{O_{21}}{W_2}\),..., \(p_r=\frac{O_{r1}}{W_r}\).
Hypotheses:
Formulas: The test statistic is defined by:
This statistic has the \(\chi^2\) distribution with 1 degree of freedom.