 PQStat
Bland-Altman plot
When to use:
The Bland-Altman plot (Bland and Altman, 1986[22], 1999[8]) is used for the graphical assessment of agreement between two methods of measuring the same quantity, e.g. two different blood pressure monitors, two laboratory analysers, or a new method compared with the one currently in use (the so-called gold standard). In clinical medicine, measurements taken on a living organism are constantly changing and their true value is unknown (e.g. arterial blood pressure), which calls for the continual refinement and development of new, better measurement tools. Usually, when a new method is created, its results are compared with an already established method. The new method cannot be expected to give exactly the same result as the method used so far, but it is worth checking how much the results obtained actually differ. For a new method to replace an old one, the difference between the results of the two methods should be small enough not to create a problem for clinical interpretation – for example, in blood pressure measurements a difference of 20mmHg is already large enough that it could affect the decision to start treatment. Statistical methods cannot directly answer the question of how large a difference between methods is acceptable for them to be considered concordant, but an appropriate graphical illustration of the differences obtained and their possible limits of variability makes such a decision easier.
Definitions of measures
The Bland-Altman plot is a scatter plot in which:
- X axis
– the mean of the measurements for the two compared methods;
- Y axis
– the difference between the measurements for the two compared methods;
- Mean difference
– if the results obtained by the new method are consistently greater/smaller than those obtained by the old method, a shift called bias occurs, i.e. the line representing the mean difference is not at the 0 level, but is shifted significantly up or down from it;
95% limits of agreement – if the differences are normally distributed, 95% of the differences will lie within the interval (Mean difference \(\pm\) 1.96SD), where SD is the standard deviation of the differences.
Note! The interval of agreement defined above is not the same thing as a confidence interval. Nor is there a requirement that the data themselves be normally distributed – it is enough that the distribution of the differences does not deviate significantly from a normal distribution. Conformity of the differences with a normal distribution can be checked using tests for normality, or by graphical interpretation of that distribution.- Precision of the limits of agreement
– the confidence interval for the limits of agreement, i.e. the interval of accuracy with which we determine these limits on the basis of a representative sample. The larger the sample and the smaller the variance of the differences, the greater the precision obtained.
How to set up the analysis
The Bland-Altman plot is available as an additional graphical option in the analysis windows used for comparing two dependent series of measurements of the same quantity (e.g. when comparing the results of two instruments or two assessment methods). Simply select the appropriate plot option in the window of the chosen analysis to obtain an agreement plot for the compared methods.
Performing and interpreting the analysis
Example 1. (pressure_gauge.pqs file)
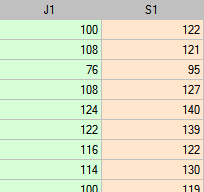
This example is taken from the work of Bland and Altman (1999[8]). It compared a semi-automatic blood pressure monitor (S) with the classic blood pressure monitor (J) that had traditionally been used before. For this purpose, systolic blood pressure was measured for 85 patients using both monitors. An excerpt of the data is shown below.
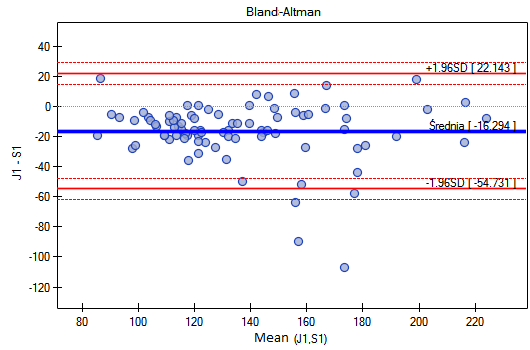
The Bland-Altman plot for the collected data shows that the semi-automatic monitor (S) gives readings that are on average 16.3mmHG higher than the classic monitor (the line for the mean difference lies 16.3 below the line of absolute agreement at the 0 level). The span of the agreement interval is as much as 76.9mmHG.
For people with hypertension (systolic pressure \(\geq\) 140), pressure changes can be quite large, so the measured differences may be distorted by genuine spikes in pressure. For this reason, a subgroup of people with normal blood pressure and a subgroup with hypertension were separated out on the basis of the mean pressure value. We can produce the plot separately for each subgroup by setting a multiple filter on the variable group in the test window. The agreement between the methods for people with normal blood pressure will then be markedly better (a narrower agreement interval).
The Bland-Altman plot for repeated measurements
The repeatability of measurements is an important, but often overlooked, aspect of studying the agreement between methods. A method with greater repeatability is more precise. If the measurements of one of the compared methods are not repeatable (i.e. repeated measurements taken on the same objects tend to give different results), its agreement with the other method will be low. If the repeatability of both methods is poor, their agreement will be even lower. As a consequence, when the repeatability of the old method is poor, the agreement of the new method may turn out to be low even if the new method itself has high repeatability. This is why, although in practice a single measurement is usually taken for each object (patient), in studies aimed at estimating agreement it is recommended that measurements be taken several times – this makes it possible to take the repeatability of the results obtained into account in the agreement study.
Example (1) continued (pressure_gauge.pqs file)
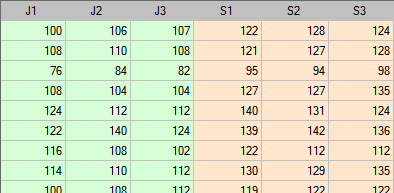
In comparing the agreement between measurements taken with the two blood pressure monitors, the repeatability of both methods was also taken into account. For this reason, the study was repeated two more times, ultimately yielding, for each patient, 3 measurements taken with the semi-automatic monitor and 3 measurements taken with the classic monitor. An excerpt of the data is shown below.
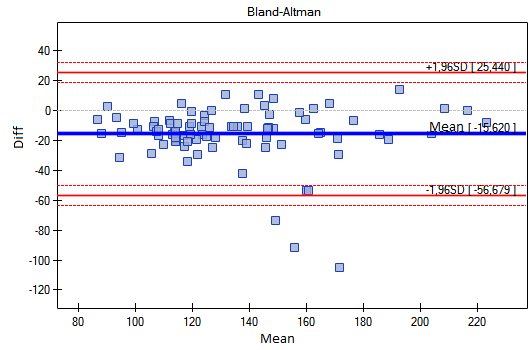
This time the limits of agreement are somewhat wider than when a single measurement was used for each method – the span of the agreement interval is as much as 82.11mmHG. This happens because we are now taking the degree of repeatability of the measurements into account. Unfortunately, taking several repetitions into account increases the width of the limits, but the results obtained better represent reality – disregarding the degree of repeatability would amount to assuming 100% repeatability, which is almost impossible under real conditions.
As before, it is recommended to repeat the analysis separately for people with hypertension and those with normal blood pressure.