 PQStat
The ANOVA for dependent groups with Epsilon correction and MANOVA
When to use this test:
The Epsilon corrections and the multivariate MANOVA approach apply to the ANOVA for dependent groups and are used when the sphericity assumption is not met, i.e. when the variances of the differences between all pairs of measurements are not close to each other.
Assumptions
- measurement on an interval scale,
- the normal distribution for all variables that are the differences of measurement pairs,
- a dependent model,
- lack of sphericity (otherwise the ANOVA for dependent groups without correction is sufficient).
The degree to which sphericity is met is represented by the value of \(W\) in Mauchly's test, as well as by the Epsilon (\(\varepsilon\)) values calculated together with the corrections. \(\varepsilon=1\) indicates strict adherence to the sphericity condition – the smaller the value of Epsilon is below 1, the more the sphericity assumption is violated (the lower limit Epsilon can reach is \(\frac{1}{k-1}\)).
Three corrections are available for adjusting the degrees of freedom of the \(F\) test: the simplest but weakest Epsilon lower-bound correction; the somewhat stronger, though still conservative, Greenhouse-Geisser correction (1959)[73]; and the strongest Huynh-Feldt correction (1976)[88]. When sphericity is significantly violated, however, it is most advisable to perform an analysis that does not require this assumption, namely MANOVA (multivariate analysis of variance) – applied to repeated measures (without an independent-groups factor), it tests the same hypothesis as the ANOVA for dependent variables, based on the differences between adjacent measurements. A broader discussion of this method can be found in the one-way MANOVA chapter.
How to set up the analysis
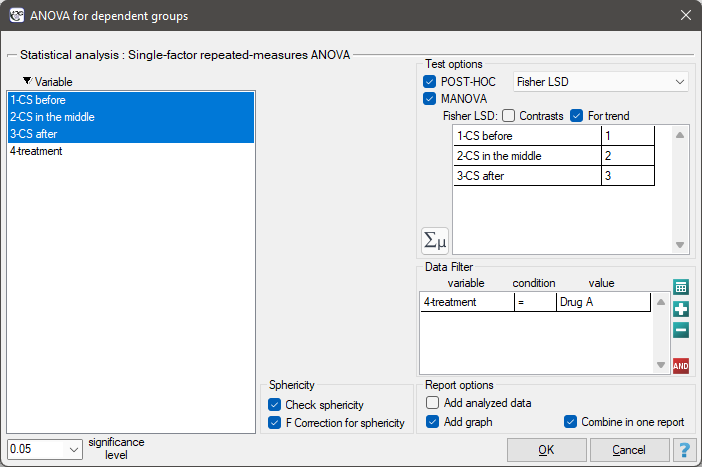
Statistics \(\to\) Parametric tests \(\to\) ANOVA for dependent groups (or via the Wizard).
Performing and interpreting the analysis
Example 1. (pressure.pqs file)
The effectiveness of two treatments for hypertension was studied. A sample of 56 patients was collected and randomly assigned to two groups: a group treated with drug A and a group treated with drug B. Systolic blood pressure was measured three times in each group: before treatment, during treatment, and after 6 months of treatment. We will check whether, in each group, the mean systolic blood pressure changes across the treatment stages.
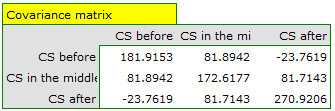
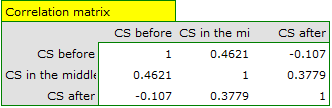
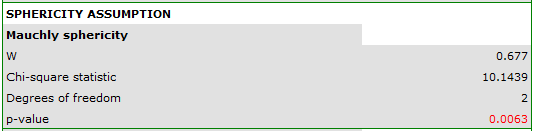
Since the data are normally distributed, we begin the analysis by checking the sphericity assumption – testing is performed for each group separately, using a multiple filter. Failure to meet the sphericity assumption in the group treated with drug B is indicated both by the observed values of the covariance and correlation matrices and by the result of Mauchly's test (\(W=0.68\), \(p=0.0063\)).
We resume the analysis  and, in the test options window, select the primary filter to perform a repeated-measures ANOVA for those treated with drug A, followed by a correction of this analysis and the MANOVA statistic for those treated with drug B.
Results for those treated with drug A:
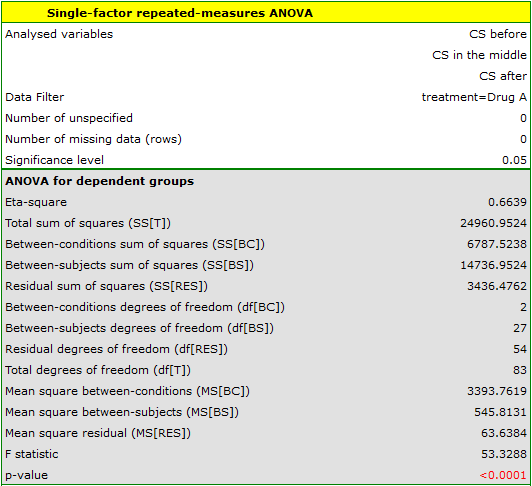
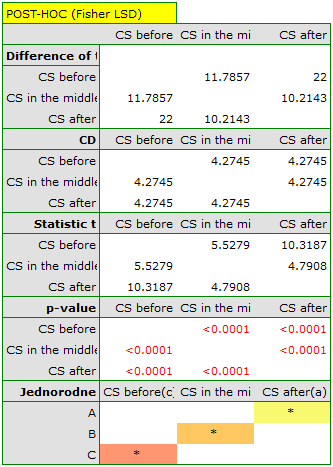
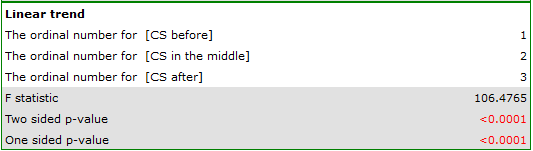
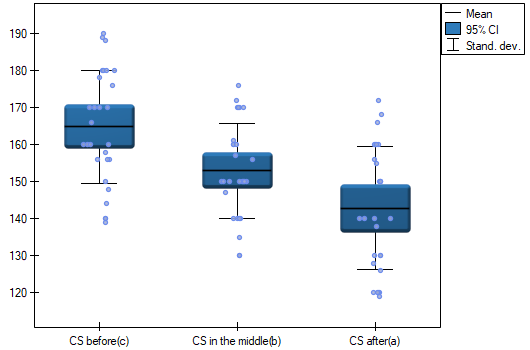
More than 66% of the within-subject variation in outcomes can be explained by the use of drug A (\(\eta^2=0.66\)). The differences apply to all treatment stages compared (POST-HOC result). The decreasing trend in systolic blood pressure due to treatment is also significant (\(p<0.0001\)) – so drug A can be considered effective.
Results for those treated with drug B:
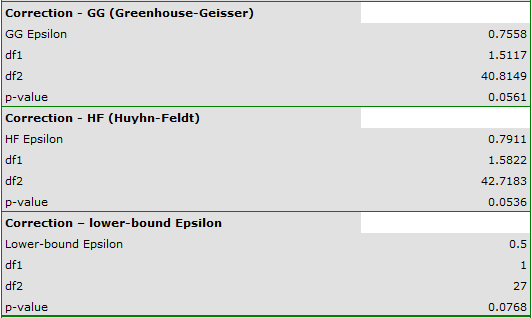
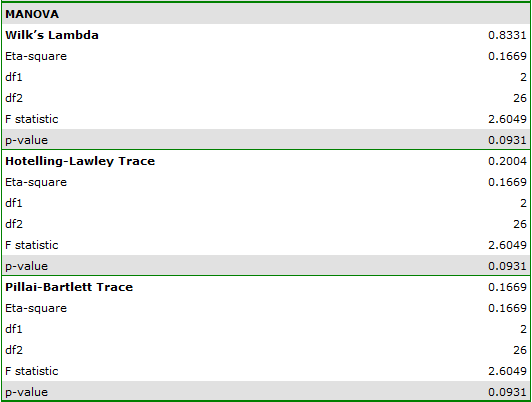
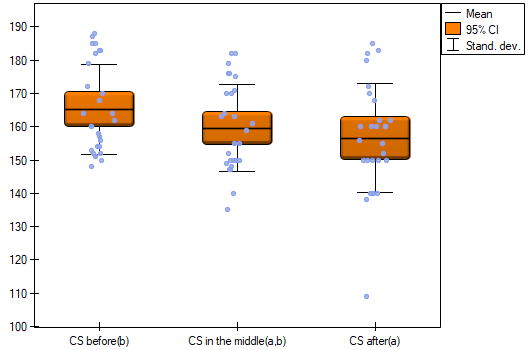
Barely under 17% of the within-subject variation in outcomes can be explained by the use of drug B (\(\eta^2=0.17\)).