 PQStat
Logistic regression
When to use:
The constructed logistic regression model (similarly to multiple linear regression) allows the study of the effect of many independent variables (\(X_1, X_2,..., X_k\)) on one dependent variable (\(Y\)). This time, however, the dependent variable only takes two values, e.g. ill/healthy, insolvent/solvent, etc. These two values are coded as (1)/(0), where (1) is the distinguished value – having the feature, and (0) – not having the feature.
The function on which the logistic regression model is based does not calculate the two-level variable \(Y\) itself, but the probability of that variable taking the distinguished value:
where:
\(P(Y=1|X_1,X_2,...,X_k)\) – the probability of taking the distinguished value (1), given specific values of the independent variables, the so-called predicted probability for 1,
\(Z\) is most often expressed by a linear relationship: \(Z=\beta_0+\sum_{i=1}^k\beta_iX_i\),
\(X_1,X_2,\ldots X_k\) – independent, explanatory variables,
\(\beta_0,\beta_1,\beta_2,\ldots \beta_k\) – parameters.
The logit is the transformation of this model into the form:
Assumptions
- the dependent variable \(Y\) is dichotomous, coded as (1)/(0),
- the independent variables are not collinear,
- a sufficiently large number of observations.
When building the model, remember that the number of observations should be at least ten times the number of estimated model parameters (\(n\ge 10(k+1)\)). However, a more restrictive criterion, proposed by P. Peduzzi and others in 1996[135], is increasingly used, stating that the number of observations should be at least ten times the ratio of the number of independent variables (\(v\)) to the smaller of the proportions of counts (\(p\)) described by the dependent variable (i.e. the proportion of ill or healthy subjects), i.e. \(n\ge 10v/p\).
When building the model, remember that the independent variables should not be collinear. When collinearity is present, estimation may become unreliable, and the resulting error values very high. Collinear variables should be removed from the model, or a single independent variable should be built from them, e.g. instead of the collinear variables mother's age and father's age, a variable parents' age could be built.
The convergence criterion of the Newton-Raphson iterative algorithm can be controlled using two parameters: the convergence iteration limit (gives the maximum number of iterations in which the algorithm should reach convergence) and the convergence criterion (gives the value below which the improvement in estimation obtained is considered insignificant, and the algorithm terminates).
Definitions of measures
Dummy variables and interactions in the model – a discussion of the preparation of dummy variables and interactions is presented in section Preparation of variables for analysis in multivariate models Preparation of variables for analysis in multivariate models.
Regression coefficients – the solution of the model equation is the vector of parameter estimates \(\beta_0,\beta_1,\ldots,\beta_k\), called the regression coefficients (\(b_0, b_1,...,b_k\)), estimated using the maximum likelihood method, i.e. by searching for the maximum of the likelihood function \(L\) (the program uses the iterative Newton-Raphson algorithm). On the basis of these values, we can draw conclusions about the magnitude of the effect of the independent variable (for which the coefficient was estimated) on the dependent variable. Each coefficient carries a certain estimation error, calculated from the formula \(SE_b=\sqrt{diag(H^{-1})_b}\), where \(diag(H^{-1})\) is the main diagonal of the covariance matrix.
Individual Odds Ratio – on the basis of the coefficients, for each independent variable in the model, an easily interpretable measure is calculated: the individual Odds Ratio:
The resulting Odds Ratio expresses the change in the odds of the distinguished value (1) occurring, when the independent variable increases by 1 unit. This result is adjusted for the other independent variables in the model, in the sense that they are assumed to remain at a constant level while the independent variable studied increases by one unit. The OR value is interpreted as follows:
- \(OR >1\) means the independent variable studied has a stimulating effect on obtaining the distinguished value (1), i.e. it tells us by how much the odds of the distinguished value (1) occurring increase when the independent variable increases by one level;
- \(OR <1\) means the independent variable studied has a de-stimulating effect on obtaining the distinguished value (1), i.e. it tells us by how much the odds of the distinguished value (1) occurring decrease when the independent variable increases by one level;
- \(OR\approx1\) means the independent variable studied has no effect on obtaining the distinguished value (1).
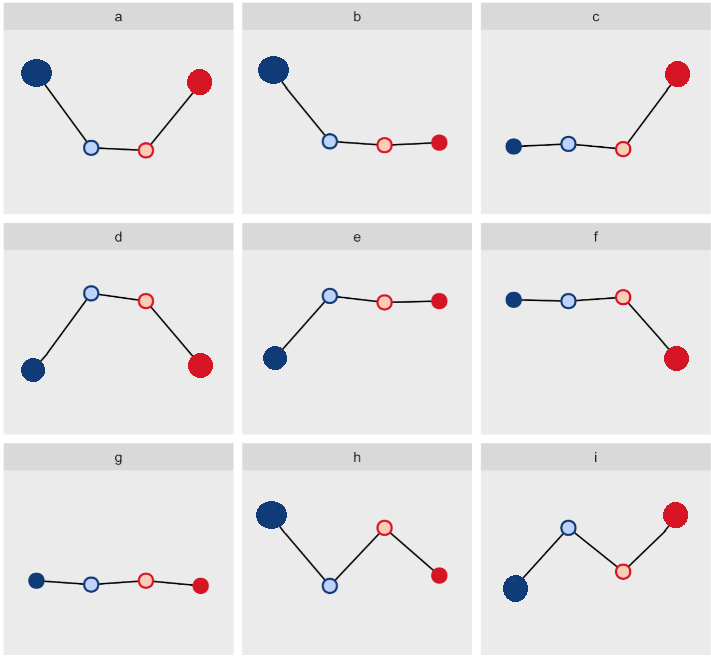
U-smile – a plot of four subclasses (non-events: better and worse prediction; events: worse and better prediction) with the selected coefficient (\(rLR\), \(BA\) or \(RB\)) on the Y axis; the point size corresponds to the share \(I\) of the subclass, the class lines are solid when the improvement is significant (for \(rLR\)), and the horizontal reference line denotes no change. A smile means an improvement in prediction relative to the null model in both classes (see U-smile).
Odds Ratio – general formula – PQStat calculates the individual Odds Ratio. Its modification, based on the general formula, allows the interpretation of the result obtained to be changed. The odds ratio for the distinguished state occurring, in the general case, is calculated as the ratio of two odds, computed for two categories of the independent variable being compared.
How to set up the analysis
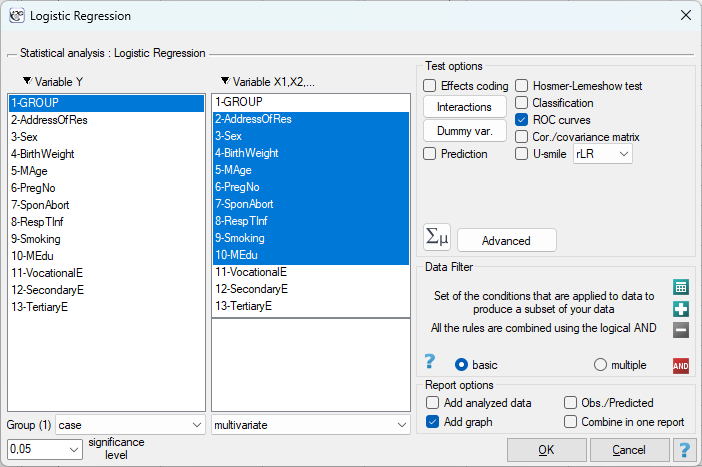
Advanced statistics \(\to\) Multivariate models \(\to\) Logistic regression.
Model verification
Statistical significance of individual variables in the model (significance of the odds ratio) – on the basis of the coefficient and its estimation error, we can infer whether the independent variable for which this coefficient was estimated has a significant effect on the dependent variable. For this purpose, we use the Wald test.
Quality of the constructed model – a good model should meet two basic conditions: it should be well fitted and as simple as possible. The quality of a logistic regression model can be assessed using several measures, based on: \(L_{FM}\) – the maximum of the likelihood function of the full model (with all variables), \(L_0\) – the maximum of the likelihood function of the model containing only the intercept, \(n\) – the sample size:
- Information criteria (\(AIC\), \(AICc\), \(BIC\)) – based on the entropy of the information carried by the model. We should choose the model with the minimum value of the given information criterion.
- Pseudo R\(^2\) – the so-called McFadden R\(^2\), is a measure of model fit (the equivalent of the multiple coefficient of determination \(R^2\) used in multiple linear regression). The value of this coefficient falls within the range \(\langle0; 1)\), where values close to 1 indicate a very good model fit. Since the \(R^2_{Pseudo}\) coefficient never reaches 1 and is sensitive to the number of variables in the model, its adjusted values are also calculated: \(R^2_{Nagelkerke}\) and \(R^2_{Cox-Snell}\).
- Statistical significance of all variables in the model – the basic tool for estimating the significance of all variables in the model is the likelihood ratio test.
- Hosmer-Lemeshow test – for different subgroups of the data, compares the observed frequencies of the distinguished value, \(O_g\), with the predicted probability, \(E_g\). If \(O_g\) and \(E_g\) are sufficiently close, the constructed model can be assumed to be well fitted. For the calculations, the observations are first divided into \(G\) subgroups, usually deciles (\(G=10\)).
- AUC – the area under the ROC curve – the ROC curve, built on the basis of the value of the dependent variable and the predicted probability of the dependent variable \(P\), allows the ability of the constructed logistic regression model to classify cases into two groups, (1) and (0), to be assessed. Additionally, for the ROC curve, a suggested value of the cut-off point for the predicted probability is given, together with a table showing sensitivity and specificity for every possible cut-off point.
Classification – based on the chosen cut-off point of the predicted probability, the quality of classification can be checked. The default cut-off point is \(0.5\). The user can change this value to any value from the range \((0,1)\), e.g. the value suggested by the ROC curve. As a result, we obtain a classification table and the percentage of correctly classified cases, the percentage of correctly classified (0) – specificity, and the percentage of correctly classified (1) – sensitivity.
U-smile – evaluation of the model against the null model – the U-smile method (Universal Smile Layout for Explanation, Kubiak et al. 2024[181], Więckowska et al. 2025[182], 2026[183]) compares two models predicting the probability of an event on the same observations. In the logistic regression window, the reference model is the null model (intercept only, i.e. the event frequency in the sample), and the new model is the model built. The observations are divided into four subclasses:
- non-events (0) with better prediction (the probability decreased),
- non-events (0) with worse prediction,
- events (1) with worse prediction,
- events (1) with better prediction (the probability increased).
For each subclass the following are determined:
- a qualitative coefficient concerning the number of changes, \(I\) (the share of the subclass observations in the class),
and, to choose from, one of the quantitative coefficients concerning the magnitude of the changes:
- \(rLR\) (relative likelihood ratio) – normalised to the range \(\langle 0;1\rangle\),
- \(BA\) (Brier Alteration) – the mean change in the squared residual,
- \(RB\) (Relative Brier) – the change relative to the Brier score of the reference model.
The net coefficients for the classes (improvement minus deterioration) and the overall coefficient show by how much the model improves prediction, separately for events and non-events.
Significance is checked with the likelihood ratio test (overall), and for \(rLR\) additionally with tests for each class based on the gamma distribution.
Formulas: for those interested.
Plots in logistic regression
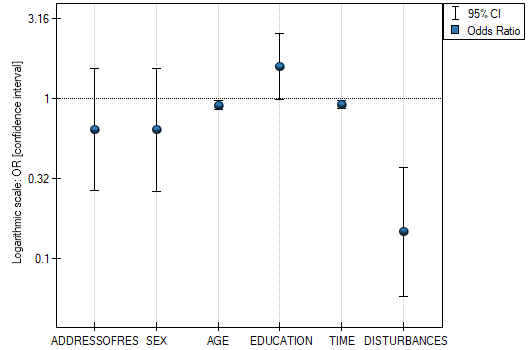
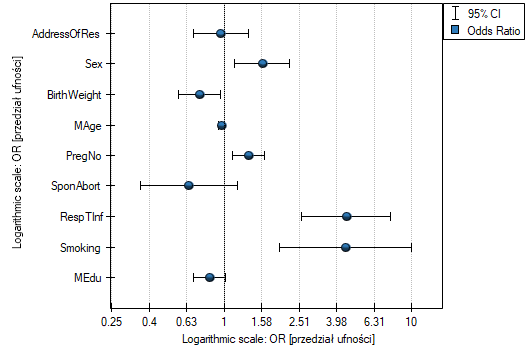
Odds ratio \(\pm\) confidence interval – a plot showing the OR together with the 95% confidence interval for the result of each variable returned in the constructed model. For categorical variables, the line at level 1 indicates the odds ratio value for the reference category.
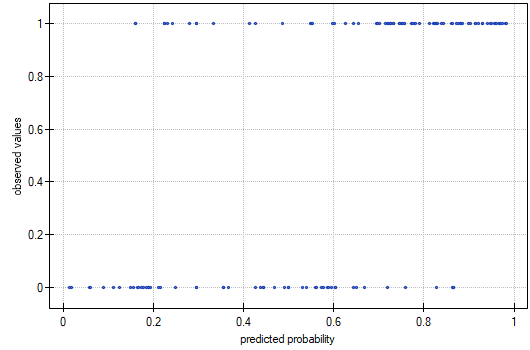
Observed values / Expected probability – a plot showing the predicted probability of an event occurring for each individual (X axis) and the true value, i.e. the occurrence of the event (value 1 on the Y axis) or its absence (value 0 on the Y axis). If the model predicts very well, points will accumulate at the bottom on the left side of the plot and at the top on the right side.
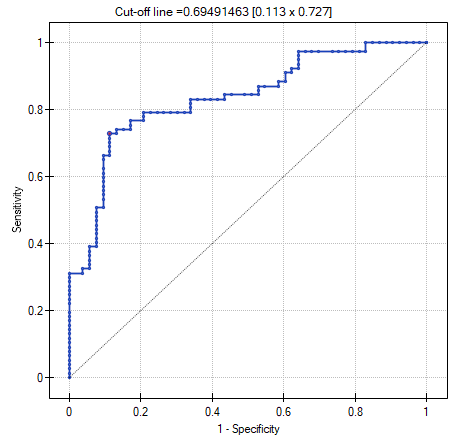
ROC curve – a plot built on the basis of the value of the dependent variable and the predicted probability of the event occurring.
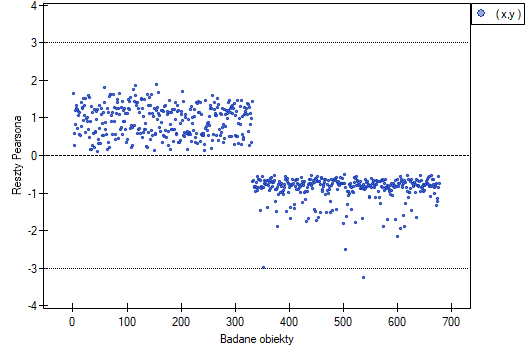
Pearson residuals plot – a plot allowing an assessment of whether outlying data are present. The residuals are the differences between the observed value and the probability predicted by the model. Plots of raw residuals from logistic regression are difficult to interpret, so they are standardised by calculating Pearson residuals (the raw residual divided by the square root of the variance function). The sign (positive or negative) indicates whether the observed value is higher or lower than the value fitted by the model, and the magnitude indicates the degree of deviation. Pearson residuals smaller than -3 or greater than 3 suggest too great a deviation for the given object.
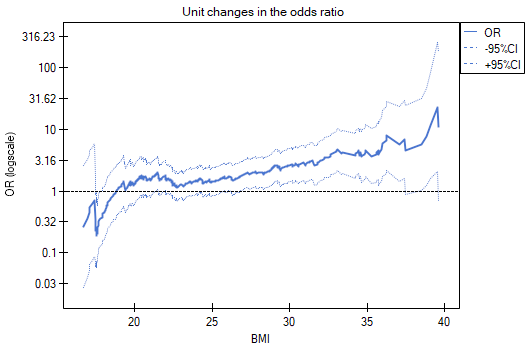
- Unit changes in the odds ratio – a plot showing a series of odds ratios, together with a confidence interval, determined for every possible cut-off point of the variable placed on the X axis. It allows the user to select one good cut-off point and then build, on this basis, a new two-valued variable. This plot is dedicated to the evaluation of continuous variables in univariate analysis.
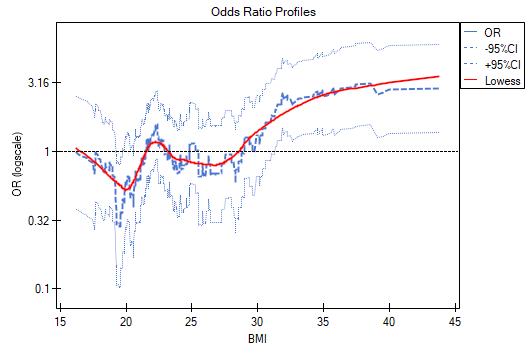
- Odds ratio profiles – a plot showing a series of odds ratios, together with a confidence interval, determined for a given window size, i.e. comparing frequencies inside the window with frequencies outside the window. It works best when we are looking for a U-shaped function, i.e. high risk at low and high values of the variable studied, and low risk at average values. The wider the window, the greater the generalisation of the results and the smoother the odds ratio function; the narrower the window, the more detailed but more erratic the results. This plot is dedicated to the evaluation of continuous variables in univariate analysis.
U-smile plot – on the U-smile plot the four subclasses form a „smile” when the model improves prediction in both classes:
- (Y axis) the size of the smile shows the magnitude of the improvement (coefficients \(rLR\), \(BA\), \(RB\) to choose from),
- (X axis) the left-hand side represents the non-event class (blue), the right-hand side the event class (red); the outer points are the subclass: improved prediction, and the inner points the subclass: worsened prediction,
- symmetry (the left side of the plot similar to the right) means that the improvement/deterioration of prediction concerns both classes in the same way,
- the point size corresponds to the coefficient \(I\), i.e. it shows how large a percentage of objects falls into each subclass,
- the class line is solid when the improvement in that class is significant (\(rLR\) only).
Examples of possible shapes of the U-smile plot. Improved prediction: (a) for both outcome classes, (b) only for non-events, (c) only for events. Worsened prediction: (d) for both outcome classes, (e) only for non-events, (f) only for events. Circles lying at a roughly constant level indicate neither improvement nor deterioration of prediction compared with the reference model (g). A zigzag indicates improved prediction in one outcome class and worsened prediction in the other (h and i).
Performing and interpreting the analysis
Example 1. (OR profiles.pqs file)
We examine the risk of disease A and disease B depending on the patient's BMI. Since BMI is a continuous variable, its inclusion in the model results in a unit odds ratio determining a linear trend of increasing or decreasing risk. We do not know whether a linear model will be a good model for analysing this risk, so before building multivariate logistic regression models, we will build several univariate models presenting this variable on plots, in order to assess the shape of the relationship studied and, on this basis, decide how the variable should be prepared for analysis. For this purpose, we will use plots of unit changes in the odds ratio and odds ratio profiles, and for the profiles we will choose a window size of 100, since almost every patient has a different BMI, so about 100 patients will fall within each window.
Disease A
Unit changes in the odds ratio show that when the BMI cut-off point is chosen somewhere between 27 and 37, we obtain a statistically significant and positive odds ratio, showing that people with a BMI above this value have a significantly higher risk of the disease than people below this value.
The odds ratio profiles show that the red curve remains close to 1, with only the end of the curve slightly higher, indicating that it may be difficult to divide BMI into more than 2 categories and choose a good reference category.
Disease B
Unit changes in the odds ratio show that when the BMI cut-off point is chosen somewhere between 22 and 35, we obtain a statistically significant and positive odds ratio, showing that people with a BMI above this value have a significantly higher risk of the disease than those below this value.
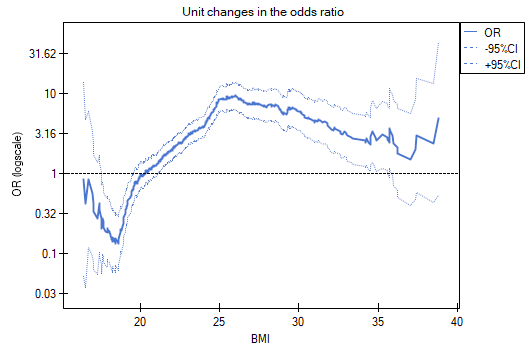
The odds ratio profiles show that it would be much better to divide BMI into 2 or 4 categories, with the reference category being the one covering a BMI somewhere between 19 and 25, since this category is the lowest and is far removed from the results for BMIs to the left and right of this range. We see a distinct U-shape, meaning that disease risk is high at both low and high BMI.
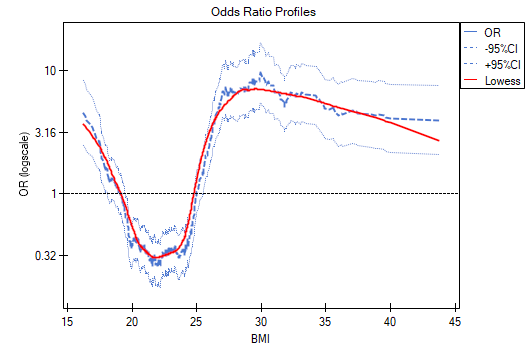
In summary, although the relationship for the unit odds ratio (linear relationship) is statistically significant, it is not worth building such a model. It is much better to divide BMI into categories, with the reference value being the average BMI. Using the standard division of BMI and setting the reference category as BMI within the normal range, we obtain more than a 15-fold higher risk for underweight people (OR[95%CI]=15.14[6.93, 33.10]), more than tenfold for overweight people (OR[95%CI]=10.35[6.74, 15.90]), and more than twelvefold for people with obesity (OR[95%CI]=12.22[6.94, 21.49]).
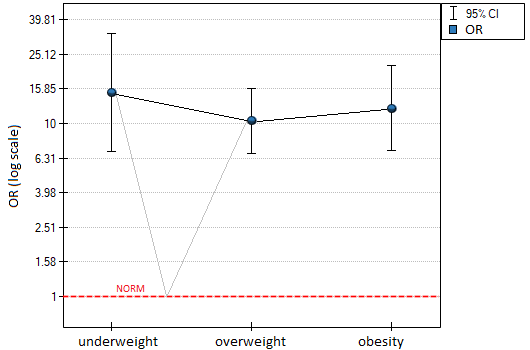
On the odds ratio plot, the BMI norm is shown at level 1, as the reference category. We have drawn lines connecting the obtained ORs, as well as the norm, to show that the shape of the relationship obtained is identical to that determined earlier through the odds ratio profile.
Example 2. (anomaly.pqs file)
A study was conducted to identify risk factors for a certain rare congenital anomaly in children. The study included 395 mothers of children with this anomaly and 375 mothers of healthy children. The data collected were: address of residence, child's sex, child's birth weight, mother's age, pregnancy number, previous spontaneous abortions, respiratory tract infections, smoking, mother's education.
We build a logistic regression model to check which variables may have a significant effect on the occurrence of the anomaly. As the dependent variable, we set the column GROUP, where the distinguished value 1 corresponds to the “cases”group, i.e. mothers of children with the congenital anomaly. The following 9 variables are independent variables: AddressOfRes (2=city/1=village), Sex (1=male/0=female), BirthWeight (in kilograms, to the nearest 0.5 kg), MAge (in years), PregNo (which pregnancy the child is from), SponAbort (1=yes/0=no), RespTInf (1=yes/0=no), Smoking (1=yes/0=no), MEdu (1=primary or lower/2=vocational/3=secondary/4=tertiary).
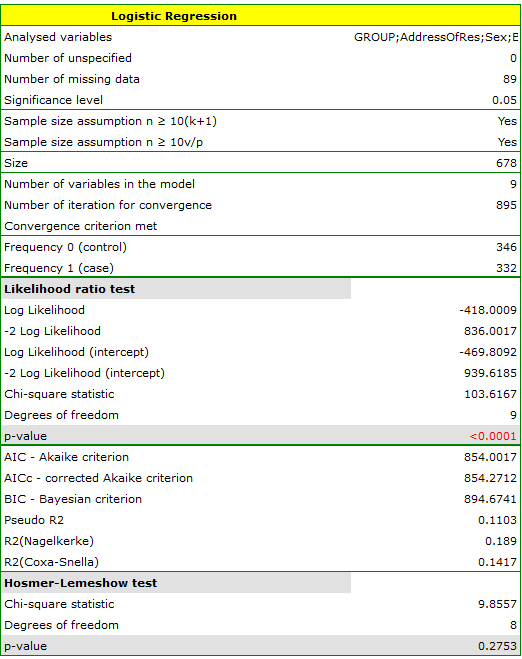
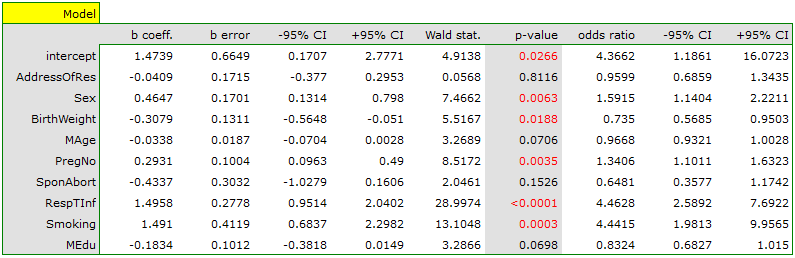
Interpretation of the individual variables in the model begins with checking their significance. In this case, the variables significantly related to the occurrence of the anomaly are: Sex (\(p=0.0063\)), BirthWeight (\(p=0.0188\)), PregNo (\(p=0.0035\)), RespTInf (\(p<0.0001\)), Smoking (\(p=0.0003\)).
The congenital anomaly studied is rare, but the odds of its occurrence depend on the variables listed above, in the manner described by the odds ratio:
- variable Sex: \(OR[95\%CI]=1.60[1.14;2.22]\) – the odds of the anomaly occurring in a boy is 1.6 times greater than in a girl;
- variable BirthWeight: \(OR[95\%CI]=0.74[0.57;0.95]\) – the higher the birth weight, the lower the odds of the anomaly occurring in the child;
- variable PregNo: \(OR[95\%CI]=1.34[1.10;1.63]\) – the odds of the anomaly occurring in the child increase 1.34-fold with each subsequent pregnancy;
- variable RespTInf: \(OR[95\%CI]=4.46[2.59;7.69]\) – the odds of the anomaly occurring in the child, when the mother had a respiratory tract infection during pregnancy, are 4.46 times greater than if she did not;
- variable Smoking: \(OR[95\%CI]=4.44[1.98;9.96]\) – a mother who smokes during pregnancy increases the odds of the anomaly occurring in her child 4.44-fold.
For statistically non-significant variables, the confidence interval for the Odds Ratio contains 1, which means these variables neither increase nor decrease the odds of the anomaly studied occurring. We therefore cannot interpret the resulting ratio in the same way as for statistically significant variables. The effect of individual independent variables on the occurrence of the anomaly can also be described using a plot of the odds ratio:
Continuation of Example 2 (anomaly.pqs file): let us build a logistic regression model once again, but this time we will split the mother's education variable into dummy variables (dummy coding). We thereby lose the information about the ordering of the education categories, but we gain the ability to analyse the individual categories in more depth. The split into dummy variables is performed by selecting Dummy var. in the analysis window:
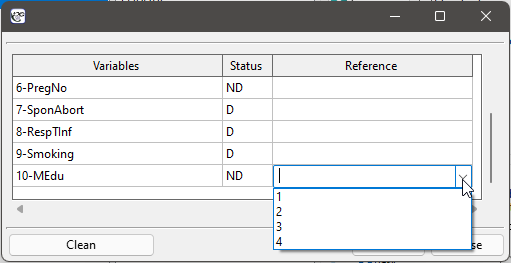
Primary education is selected as the reference category.
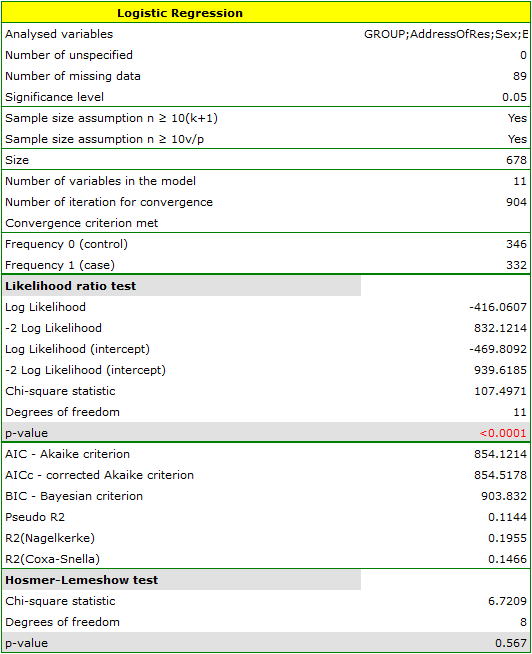
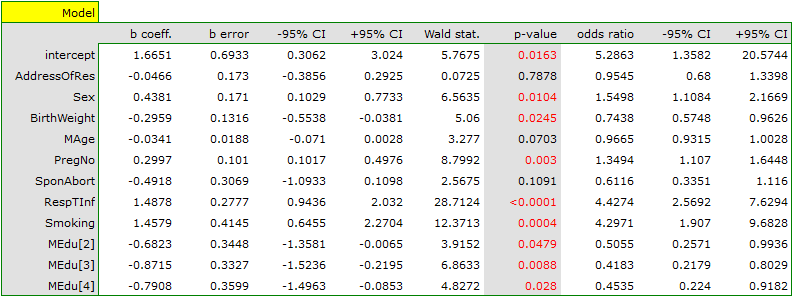
As a result, the variables describing education become statistically significant. The model fit does not change substantially, but the way the odds ratio for education is interpreted does change:
| Variable | \(OR[95\%CI]\) |
| Primary education | reference category |
| Vocational education | \(0.51[0.26;0.99]\) |
| Secondary education | \(0.42[0.22;0.80]\) |
| Tertiary education | \(0.45[0.22;0.92]\) |
The odds of the anomaly studied occurring in each education category are always compared to the odds of the anomaly occurring with primary education. We can see that for more educated mothers, the odds ratio is lower. For a mother with vocational education, the odds of the anomaly occurring in the child is 0.51 of the odds for a mother with primary education; with secondary education, 0.42; with tertiary education, 0.45.
Example 3. (task.pqs file)
An experiment was conducted to study the ability of a group of adults to concentrate in uncomfortable situations. 190 people took part in the experiment (130 people formed the training set, 40 people the test set). Each person tested was given a task that required concentration to complete. During the experiment, some people were subjected to a disturbing factor, namely an increase in air temperature to 32 degrees Celsius. Participants were also asked about their address of residence, sex, age, and education. The time allowed to complete the task was limited to 45 minutes. For participants who finished before the time limit, the actual time spent completing the task was recorded. All our calculations will be performed only for those belonging to the training set.
The variable SOLUTION (yes/no) contains the result of the experiment, i.e. information on whether the task was solved correctly or not. The remaining variables that might have influenced the result of the experiment are: ADDRESSOFRES (1=city/0=village), SEX (1=female/0=male), AGE (in years), EDUCATION (1=primary, 2=vocational, 3=secondary, 4=tertiary), TIME needed to complete the task (in minutes), DISTURBANCES (1=yes/0=no). On the basis of all these variables, a logistic regression model was built, in which the distinguished state of the SOLUTION variable was set to “yes”.
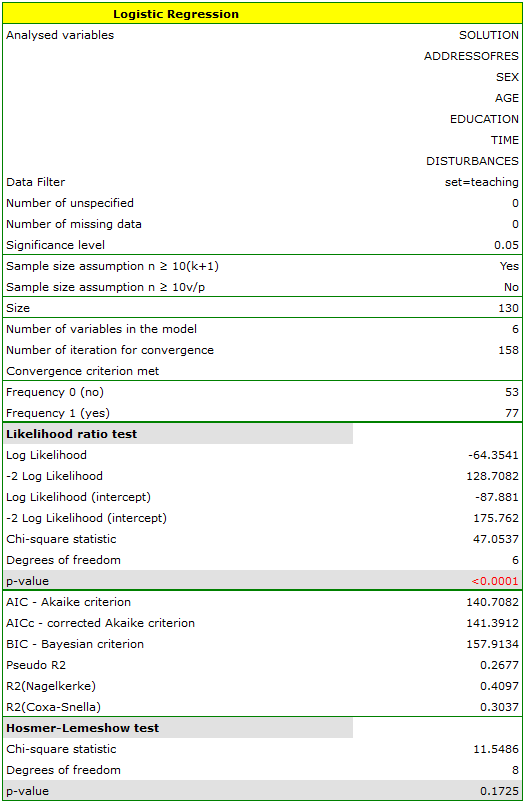
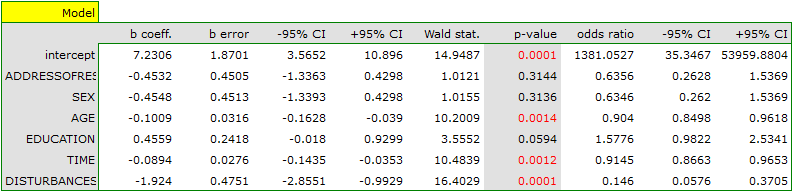
In the model, the variables that have a significant effect on the result are: AGE (\(p=0.0014\)), TIME (\(p=0.0012\)), DISTURBANCES (\(p=0.0001\)). The younger the person solving the task, the shorter the completion time, and the absence of a disturbing factor, are all associated with a greater probability of a correct solution: AGE \(OR[95\%CI]=0.90[0.85;0.96]\), TIME \(OR[95\%CI]=0.91[0.87;0.97]\), DISTURBANCES \(OR[95\%CI]=0.15[0.06;0.37]\).
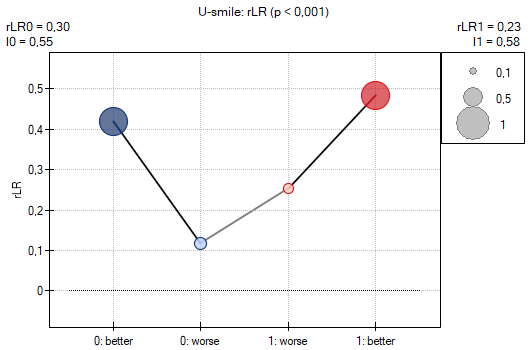
If the model is to be used for forecasting, we should assess whether it will be better at this than random classification. We draw a U-smile plot based on the goodness-of-fit coefficient \(rLR\). The plot „smiles”. The likelihood of the prediction indicating that a person will solve the task (the right-hand part of the plot) is 0.23 times greater than in the random model and, net (i.e. after subtracting the people whose likelihood decreased), this concerns 58% of the people. The plot is symmetrical and similar results apply to the left-hand side of the plot, i.e. not solving the task: \(rLR_0=0.3\), \(I_0=55\%\).
The classification quality will be assessed on the basis of the ROC curve.
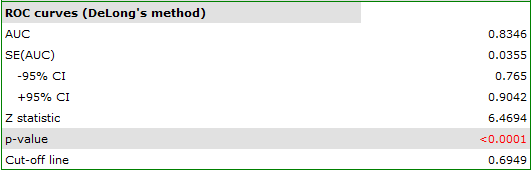
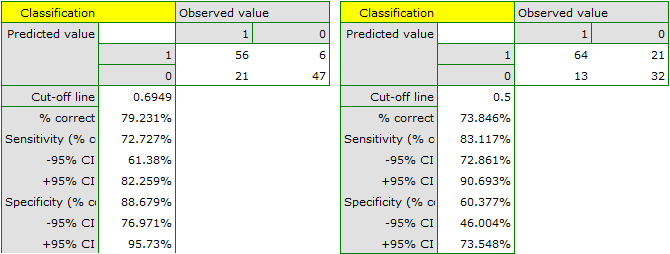
The suggested cut-off point for the ROC curve is \(0.6949\), slightly higher than the standard level used in regression, \(0.5\). The classification determined on the basis of this cut-off point gives \(79.23\%\) of cases correctly classified, of which the correctly classified “yes”values are \(72.73\%\) (sensitivity), and “no”values are \(88.68\%\) (specificity). The classification obtained from the standard value gives slightly less, \(73.85\%\) of cases correctly classified, but yields more correctly classified “yes”values (\(83.12\%\)), although fewer correctly classified “no”values (\(60.38\%\)).
At this stage, we can end the classification analysis, or, if the result is not satisfactory, we can carry out a more detailed analysis of the ROC curve in the ROC curve module.
However, let us remember that all the assessments were made only on the training set. If the model is really to be used to analyse data on which it was not trained, we should evaluate it on an independent test set. This was done in the Validation and prediction for logistic regression module, where the results were confirmed both on the U-smile plot and on the ROC curve.
Since we have concluded that the classification based on the model is satisfactory, we can calculate the predicted value of the dependent variable for any given conditions. Let us check what odds of solving the task a person has for whom: ADDRESSOFRES (1=city), SEX (1=female), AGE (50 years), EDUCATION (1=primary), TIME needed to complete the task (20 minutes), DISTURBANCES (1=yes). For this purpose, on the basis of the value of coefficient \(b\), the predicted probability is calculated:
As a result of these calculations, the program returns the result:
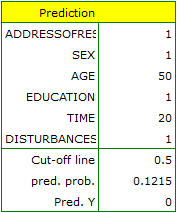
The predicted probability of solving the task is \(0.1215\), so, based on the cut-off point \(0.5\), the predicted outcome is \(0\) – meaning the task was not solved correctly.
Odds Ratio – general formula
Formulas:
For the independent variable \(X_1\), with \(Z\) expressed by a linear relationship, we calculate the odds for the first category:
and the odds for the second category:
The Odds Ratio for variable \(X_1\) is then expressed by the formula:
Example: if the independent variable is age expressed in years, the difference between neighbouring age categories, e.g. 25 and 26 years, is 1 year \(\left(X_1(2)-X_1(1)=26-25=1\right)\). We then obtain the unit Odds Ratio \(OR=\left(e^{\beta_1}\right)^1\), which tells us how the odds of the distinguished value occurring change when age changes by 1 year. The odds ratio calculated for non-neighbouring categories, e.g. 25 and 30 years, is the five-year Odds Ratio, \(OR=\left(e^{\beta_1}\right)^5\), since the difference \(X_1(2)-X_1(1)=30-25=5\).
Wald test – significance of individual variables
Hypotheses:
\(\begin{array}{cc} \mathcal{H}_0: & \beta_i=0,\\ \mathcal{H}_1: & \beta_i\ne 0. \end{array}\) or, equivalently: \(\begin{array}{cc} \mathcal{H}_0: & OR_i=1,\\ \mathcal{H}_1: & OR_i\ne 1. \end{array}\)
Formulas:
The Wald test statistic is calculated using the formula:
This statistic asymptotically (for large sample sizes) has the \(\chi^2\) distribution with 1 degree of freedom.
The \(p\) value, determined on the basis of the test statistic, is compared with the significance level \(\alpha\): if \(p \le \alpha\), we reject \(\mathcal{H}_0\) in favor of \(\mathcal{H}_1\); if \(p > \alpha\), there is no reason to reject \(\mathcal{H}_0\).
Akaike information criterion
an asymptotic criterion – suitable for large samples.
Corrected Akaike information criterion
Bayesian information criterion (Schwarz criterion)
Pseudo R\(^2\)
Likelihood ratio test
Hypotheses:
\(\begin{array}{cc} \mathcal{H}_0: & \textrm{all }\beta_i=0,\\ \mathcal{H}_1: & \textrm{there exists }\beta_i\neq0. \end{array}\)
Formulas:
The test statistic is defined by:
This statistic asymptotically (for large sample sizes) has the \(\chi^2\) distribution with \(k\) degrees of freedom.
The \(p\) value, determined on the basis of the test statistic, is compared with the significance level \(\alpha\): if \(p \le \alpha\), we reject \(\mathcal{H}_0\) in favor of \(\mathcal{H}_1\); if \(p > \alpha\), there is no reason to reject \(\mathcal{H}_0\).
Hosmer-Lemeshow test
Hypotheses:
Formulas:
The test statistic is defined by:
where \(N_g\) – the number of observations in group \(g\).
This statistic asymptotically (for large sample sizes) has the \(\chi^2\) distribution with \(G-2\) degrees of freedom.
The \(p\) value, determined on the basis of the test statistic, is compared with the significance level \(\alpha\): if \(p \le \alpha\), we reject \(\mathcal{H}_0\) in favor of \(\mathcal{H}_1\); if \(p > \alpha\), there is no reason to reject \(\mathcal{H}_0\).
Test for the significance of AUC
Interpretation:
When the ROC curve coincides with the diagonal \(y = x\), the decision to assign a case to the chosen class, based on the model, is exactly as good as a random split of the cases studied into these groups. The classification quality of the model is good when the area under the ROC curve is considerably greater than 0.5.
Hypotheses:
\(\begin{array}{cl} \mathcal{H}_0: & AUC=0.5, \\ \mathcal{H}_1: & AUC\neq 0.5. \end{array}\)
Formulas:
The test statistic is defined by:
where \(SE_{0.5}\) – the standard error of the area. The \(Z\) statistic asymptotically (for large sample sizes) has the normal distribution.
The \(p\) value, determined on the basis of the test statistic, is compared with the significance level \(\alpha\): if \(p \le \alpha\), we reject \(\mathcal{H}_0\) in favor of \(\mathcal{H}_1\); if \(p > \alpha\), there is no reason to reject \(\mathcal{H}_0\).
U-smile coefficients
Notation: \(y_i\in\{0,1\}\) – the outcome of the observation, \(p_i^{ref}\) and \(p_i\) – the event probabilities from the reference model and the new model, \(n_0\), \(n_1\) – the numbers of non-events and events, \(n=n_0+n_1\). Subclasses: \(0^{+}\) (non-events, \(p_i<p_i^{ref}\)), \(0^{-}\) (non-events, \(p_i>p_i^{ref}\)), \(1^{-}\) (events, \(p_i<p_i^{ref}\)), \(1^{+}\) (events, \(p_i>p_i^{ref}\)); observations with \(p_i=p_i^{ref}\) do not belong to any subclass.
Coefficients \(I\): \(I_0^{+}=n_0^{+}/n_0\), \(I_0^{-}=n_0^{-}/n_0\), \(I_1^{-}=n_1^{-}/n_1\), \(I_1^{+}=n_1^{+}/n_1\); net \(I_0=I_0^{+}-I_0^{-}\), \(I_1=I_1^{+}-I_1^{-}\); overall \(I=I_0+I_1\).
Coefficients \(BA\) and \(RB\): for the squared residuals \(r_i=(y_i-p_i)^2\) and \(r_i^{ref}=(y_i-p_i^{ref})^2\) and the differences of the sums of squares in subclass \(S\): \(\Delta SS_S=\sum_{i\in S} r_i^{ref}-\sum_{i\in S} r_i\)
The \(RB\) coefficients are calculated in the same way, but with the denominators \(SS_0^{ref}=\sum_{y_i=0} r_i^{ref}\) and \(SS_1^{ref}=\sum_{y_i=1} r_i^{ref}\). Net: \(BA_0=BA_0^{+}-BA_0^{-}\), \(BA_1=BA_1^{+}-BA_1^{-}\); overall \(BA=\frac{n_0}{n}BA_0+\frac{n_1}{n}BA_1\) (analogously for \(RB\)).
Coefficient \(rLR\): for the log-likelihood contributions \(\ell_i=y_i\ln p_i+(1-y_i)\ln(1-p_i)\) and \(\ell_i^{ref}\) (analogously for \(p_i^{ref}\)) and \(\Delta_S=\sum_{i\in S}\ell_i^{ref}-\sum_{i\in S}\ell_i\):
These values are normalised by the maximum attainable likelihood ratio of the class: \(\max LR_0=-2\sum_{y_i=0}\ell_i^{ref}\) (when \(LR_0^{+}\ge LR_0^{-}\); otherwise from the \(\ell_i\) of the new model), and analogously \(\max LR_1\). Hence \(rLR_0^{\pm}=LR_0^{\pm}/\max LR_0\), \(rLR_1^{\pm}=LR_1^{\pm}/\max LR_1\), \(rLR_0=LR_0/\max LR_0\), \(rLR_1=LR_1/\max LR_1\) and \(rLR=(LR_0+LR_1)/\max LR\), where \(\max LR=-2\sum_i\ell_i^{ref}\) (the sum over the observations belonging to the subclasses).
Tests: overall – the likelihood ratio test with the statistic \(2\left|\sum_i\ell_i-\sum_i\ell_i^{ref}\right|\), which asymptotically has the \(\chi^2\) distribution with \(df\) equal to the difference in the number of parameters of the compared models (at least 1). For \(rLR\), the significance of the change within a class is checked using the gamma distribution: \(|LR_1|\sim\Gamma\left(\frac{df}{2},\frac{1}{2c_1}\right)\) and \(|LR_0|\sim\Gamma\left(\frac{df}{2},\frac{1}{2c_0}\right)\), where \(c_1=n_1/n\), \(c_0=1-c_1\) (shape and rate parameters). The determined \(p\) values are compared with the significance level \(\alpha\): if \(p \le \alpha\), the change in prediction is considered significant.