 PQStat
The Chi-square test for small tables
When to use this test:
The \(\chi^2\) test for \(2\times 2\) tables (also known as Pearson's Chi-square test, Karl Pearson 1900) is used when we want to check whether two features with two categories each (e.g. sex and exam passing) are related. It is a special case of the \(\chi^2\) test for \(r\times c\) tables for the smallest possible table.
Assumptions
- measurement on a nominal scale,
- an independent model,
- a \(2\times 2\) contingency table (see table (1)).
How to set up the analysis
Statistics \(\to\) NonParametric tests \(\to\) Chi-square, Fisher, OR/RR (or via the Wizard).
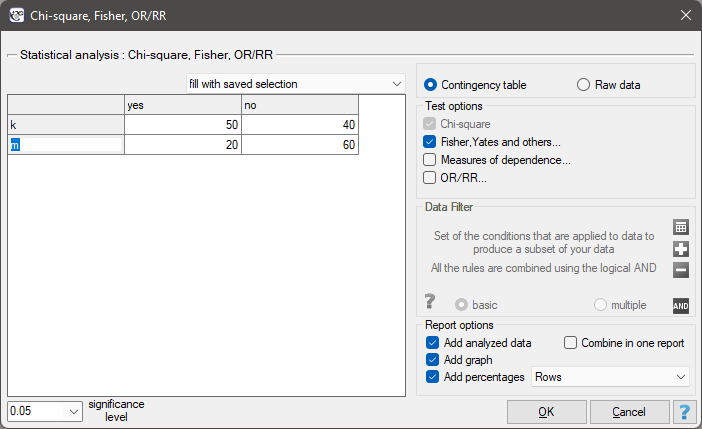
Performance and interpretation
Example 1. (sex-exam.pqs file)
There is a sample of 170 people (\(n=170\)), for whom 2 features are analysed (\(X\)=sex, \(Y\)=exam passing). Each of these features occurs in two categories (\(X_1\)=f, \(X_2\)=m, \(Y_1\)=yes, \(Y_2\)=no). Based on this sample, we would like to find out whether there is a dependence between sex and exam passing in the analysed population. The data distribution is shown in the contingency table below:
| Observed frequencies | exam passing | |||
| \(O_{ij}\) | yes | no | total | |
| sex | f | 50 | 40 | 90 |
| m | 20 | 60 | 80 | |
| total | 70 | 100 | 170 | |
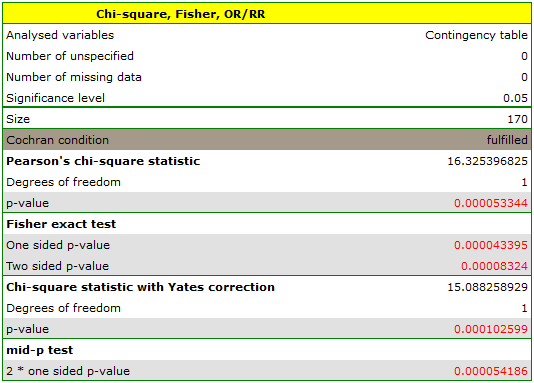
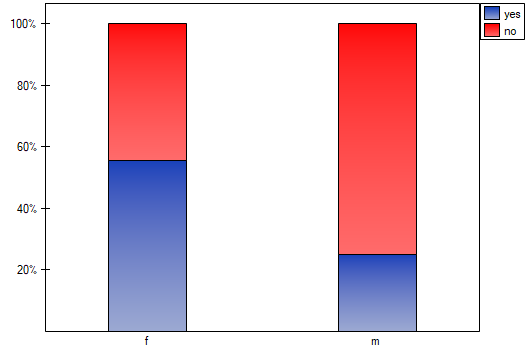
The table of expected frequencies contains no values below 5, so Cochran's condition is satisfied – the basic \(\chi^2\) test could be applied directly. The other test variants lead to the same conclusion: the test with Yates correction (\(p=0.000103\)), Fisher's exact test (\(p=0.000083\)), and the mid-p test (\(p=0.000054\)).
Hypotheses:
Formulas: The test statistic is defined by:
This statistic asymptotically (for large expected frequencies) has the \(\chi^2\) distribution with 1 degree of freedom.