 PQStat
The Wilcoxon test (signed-ranks)
When to use this test:
The Wilcoxon signed-ranks test (Wilcoxon signed-ranks test), also known as the single-sample Wilcoxon test (Wilcoxon, 1945, 1949[173]), lets you verify the hypothesis that the sample studied comes from a population for which the median (\(\theta\)) is a known value.
Assumptions
- measurement on an ordinal scale or an interval scale.
Definitions of measures
Cohen's d – a standardised effect size. The distribution of the Wilcoxon test statistic is approximated by the normal distribution, which can be converted into the effect size \(r=\left|Z/n\right|\)[68], from which Cohen's d is then obtained using the standard conversion used in meta-analyses. When interpreting an effect, researchers often use general guidelines defined by Cohen[47], defining a small (0.2), medium (0.5), and large (0.8) effect size.
How to set up the analysis
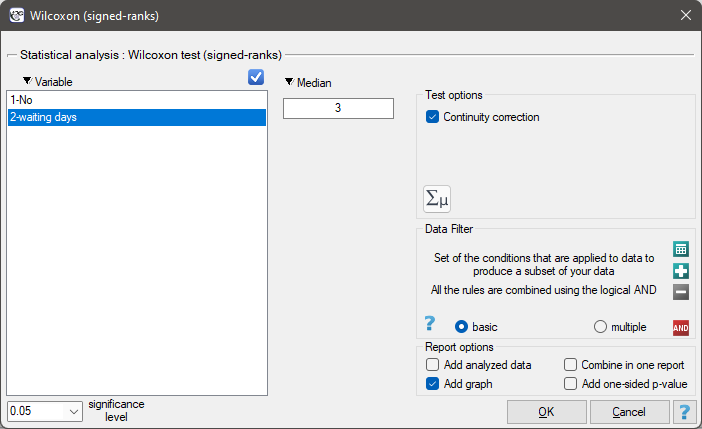
Statistics \(\to\) Nonparametric tests \(\to\) Wilcoxon (signed-ranks) (or via the Wizard).
Performing and interpreting the analysis
Continuation of Example 1 (courier.pqs file): this time, instead of the mean, we will check the median number of days of waiting for a delivery.
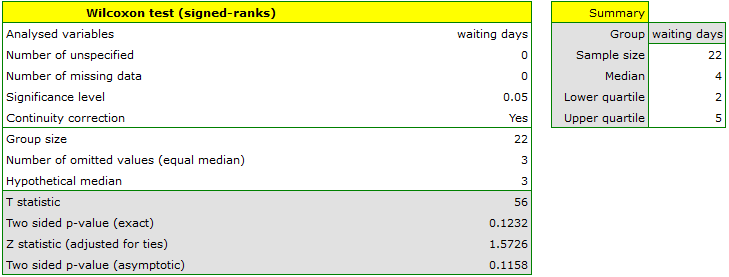
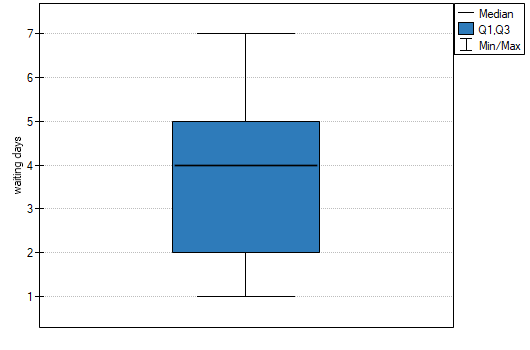
We would reach the same conclusion on the basis of the value \(p=0.111161\) or \(p=0.115817\) of the Wilcoxon test based on the \(Z\) statistic, or \(Z\) with the continuity correction.
Hypotheses:
Hypotheses relate to the equality of the sum of positive and negative ranks, or are simplified to medians:
\(\begin{array}{cl} \mathcal{H}_0: & \theta=\theta_0, \\ \mathcal{H}_1: & \theta\neq \theta_0. \end{array}\)
where:
\(\theta\) – the median of the feature studied in the population represented by the sample studied,
\(\theta_0\) – a given value.
We determine the value of the test statistic \(Z\) (\(T\) – for a small sample size), and on this basis the \(p\) value, which we compare with the significance level \(\alpha\): if \(p \le \alpha\), we reject \(\mathcal{H}_0\) in favor of \(\mathcal{H}_1\); if \(p > \alpha\), there is no reason to reject \(\mathcal{H}_0\).
For a small sample size
where \(\sum R_+\) and \(\sum R_-\) are, respectively, the sum of positive ranks and the sum of negative ranks. This statistic has the Wilcoxon distribution.
For a large sample size
where:
\(n\) – the number of ranked signs (the number of ranks),
\(t\) – the number of cases included in a tied rank.
The formula for the test statistic \(Z\) includes a correction for tied ranks. This correction should be used when tied ranks are present (when there are no tied ranks, the correction is not calculated, since then \(\left(\sum t^3-\sum t\right)/48=0\)). The \(Z\) statistic asymptotically (for large sample sizes) has the normal distribution.
Continuity correction for the Wilcoxon test (Marascuilo and McSweeney, 1977[117])
A continuity correction is used to allow the test statistic to take on all values of real numbers, in line with the assumption of a normal distribution. The formula for the test statistic with the continuity correction is then:
Cohen's d