 PQStat
Scale reliability
When to use:
Reliability analysis is most often performed when we are building a composite scale, i.e. a questionnaire or test made up of many individual items (questions) which we sum up into a single score. We then want to check whether the individual questions really measure the same thing – in other words, to what extent we can trust that the total score obtained from the scale accurately reflects the studied trait (e.g. competence, level of anxiety, job satisfaction). This is what is meant by the reliability of a scale, understood as its internal consistency.
Assumptions
- a scale made up of at least several items (questions), which are summed to a single overall score,
- the individual scale items should measure the same construct, i.e. the correlation between them should be high – this assumption can be checked by calculating the matrix of Pearson correlation coefficients between the scale items.
Definitions of measures
Although various measures of agreement can be used for the issue of reliability, the most commonly used technique here is Cronbach's \(\alpha\) coefficient and so-called split-half reliability.
Cronbach's \(\alpha\) coefficient (Cronbach, 1951[51]) was given this name for the first time by Cronbach in 1951. In simplified terms, it measures the ratio of the variability of the individual scale items to the variability of the whole scale (i.e. the sum of those items) – in other words, it shows how strongly the individual questions "hold together". The \(\alpha\) coefficient can take any value less than or equal to 1, including negative values, although only positive values are meaningful. If all scale items are perfectly reliable, the reliability coefficient equals 1. Besides the plain coefficient \(\alpha_C\), a standardised version (\(\alpha_{standard}\)) is also calculated, based on the mean correlation between the scale items.
The usefulness of particular scale items can be assessed with the help of:
- the value of the \(\alpha_C\) coefficient calculated after removing a given scale item,
- the value of the standard deviation of the scale calculated after removing a given scale item,
- the mean value of the scale calculated after removing a given scale item,
- the value of the correlation between a given item and the sum of the remaining items.
If, after removing an item, the \(\alpha_C\) coefficient clearly increases, this is a signal that the item fits poorly with the rest of the scale, and it is worth considering removing or rewording it.
Split-half reliability is a different approach to the same issue. It consists of randomly dividing the scale items into two halves and checking how far the two halves agree with (are correlated with) each other. For this purpose, the Spearman-Brown split-half reliability coefficient is used, published independently by Spearman (1910)[159] and Brown (1910)[35], as well as an alternative formula proposed by Guttman (1945)[75]. If two randomly chosen halves of the scale are perfectly correlated, the split-half reliability coefficient equals 1.
Additionally, for a scale found to be reliable, the standard error of measurement (SEM) is determined, which indicates how large a spread of the measurement result can be expected due to the imperfect reliability of the scale – the lower the reliability, the larger the measurement error.
How to set up the analysis
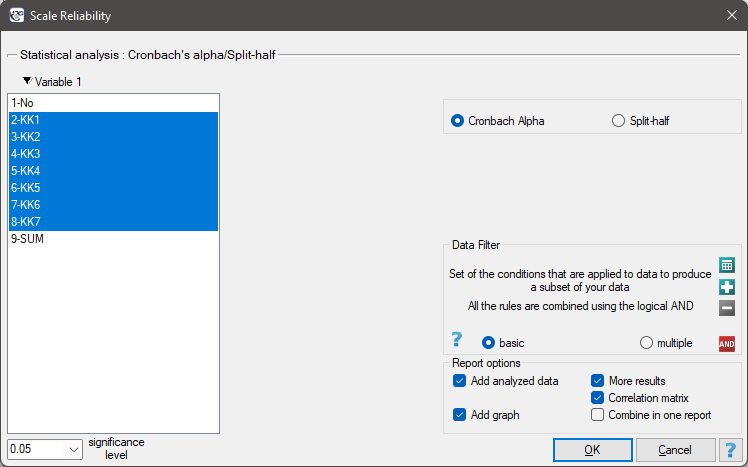
The window with the scale reliability options is opened through the Statistics\(\to\)Scale reliability menu.
Performing and interpreting the analysis
Example 1. (scale.pqs file)
A "competence scale" developed in-house is used, among other tools, to help assess the suitability of prospective employees of a certain consulting company. In addition to a job interview, candidates fill in a questionnaire that includes, among others, questions making up the "competence scale". The scale contains 7 questions. For each question, from 1 to 5 points can be scored, where 1 denotes the lowest and 5 the highest possible mark. A total of 35 points can be obtained. The scores on this scale obtained by 24 candidates are shown in the table below:
| No. | KK1 | KK2 | KK3 | KK4 | KK5 | KK6 | KK7 | TOTAL |
| 1 | 3 | 3 | 5 | 5 | 5 | 5 | 1 | 27 |
| 2 | 5 | 4 | 4 | 3 | 3 | 5 | 1 | 25 |
| 3 | 5 | 5 | 3 | 5 | 3 | 2 | 1 | 24 |
| 4 | 1 | 2 | 5 | 5 | 5 | 5 | 2 | 25 |
| 5 | 4 | 5 | 5 | 5 | 5 | 5 | 1 | 30 |
| 6 | 4 | 4 | 5 | 5 | 5 | 5 | 3 | 31 |
| 7 | 1 | 1 | 5 | 5 | 5 | 5 | 2 | 24 |
| 8 | 5 | 5 | 5 | 5 | 3 | 5 | 3 | 31 |
| 9 | 3 | 2 | 2 | 5 | 4 | 2 | 1 | 19 |
| 10 | 3 | 4 | 3 | 4 | 4 | 2 | 1 | 21 |
| 11 | 4 | 4 | 3 | 4 | 4 | 4 | 4 | 27 |
| 12 | 1 | 1 | 3 | 4 | 1 | 1 | 3 | 16 |
| 13 | 3 | 3 | 4 | 5 | 5 | 5 | 1 | 26 |
| 14 | 4 | 5 | 5 | 5 | 5 | 5 | 2 | 31 |
| 15 | 1 | 4 | 4 | 4 | 1 | 4 | 4 | 22 |
| 16 | 1 | 4 | 5 | 5 | 5 | 5 | 1 | 26 |
| 17 | 5 | 5 | 5 | 5 | 5 | 5 | 2 | 32 |
| 18 | 5 | 3 | 5 | 5 | 3 | 5 | 4 | 30 |
| 19 | 1 | 1 | 2 | 2 | 2 | 1 | 4 | 13 |
| 20 | 5 | 5 | 5 | 5 | 5 | 5 | 5 | 35 |
| 21 | 5 | 3 | 5 | 5 | 5 | 5 | 1 | 29 |
| 22 | 5 | 5 | 5 | 5 | 5 | 1 | 5 | 31 |
| 23 | 2 | 1 | 5 | 3 | 2 | 4 | 1 | 18 |
| 24 | 5 | 5 | 5 | 5 | 5 | 5 | 5 | 35 |
We want to check the accuracy of the tool used to assess competence (the scale applied). For this purpose, a reliability analysis will be performed.
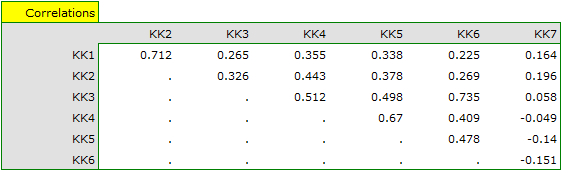
The correlation matrix shows that the last item is the most weakly correlated with the others. We therefore suspect that this item does not measure the same construct as the remaining items.
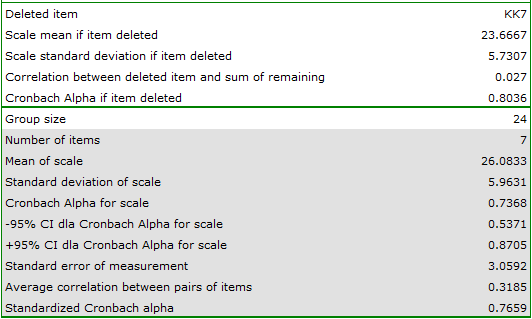
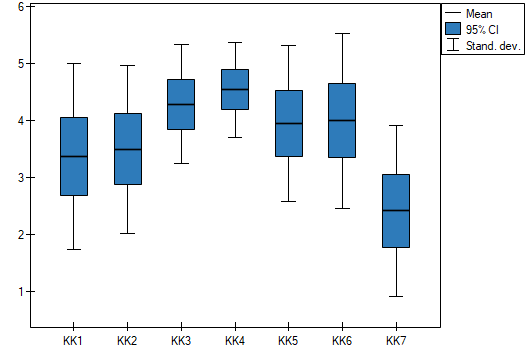
A more detailed analysis of each item shows that all of them, with the exception of the last one, contribute to the reliability of the whole scale to a similar degree. The correlation of item KK7 with the remaining scale items is the weakest, at 0.026954. If item KK7 were removed from the scale, the value of Cronbach's coefficient would rise to 0.803619.
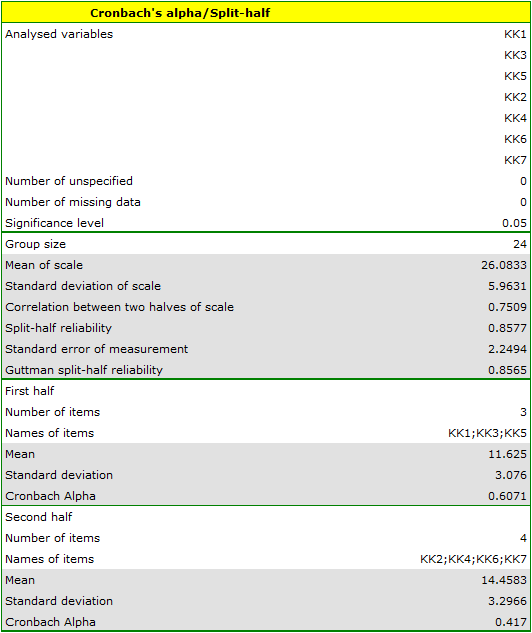
Similar conclusions can be drawn on the basis of the split-half reliability analysis performed on the items randomly divided into 2 parts (KK1, KK3, KK5) (KK2, KK4, KK6, KK7).
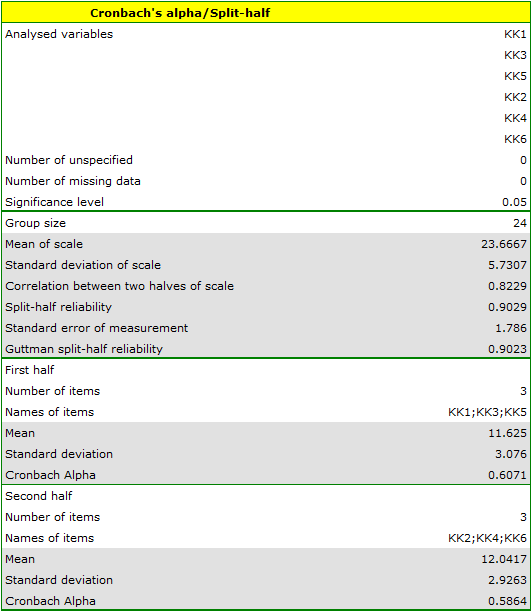
After removing this item and repeating the analysis, all the reliability coefficients are indeed higher.
Formulas
Cronbach's \(\alpha\) coefficient:
where:
\(k\) – the number of items in the scale,
\(sd_i^2\) – the variance of item \(i\),
\(sd_t^2\) – the variance of the sum of all items.
Standardised reliability coefficient:
where:
\(\overline{r_p}\) – the mean of the Pearson correlation coefficients of all (\(k(k-1)/2\)) scale items.
Spearman-Brown split-half reliability:
where:
\(r_p^*\) – the Pearson correlation coefficient between the halves of the scale.
Guttman split-half reliability:
where:
\(sd_{t1}^2\), \(sd_{t2}^2\) – the variance of the first and second half of the scale,
\(sd_t^2\) – the variance of the sum of all items.
Standard error of measurement (SEM), determined for a reliable scale:
or