 PQStat
Contingency table coefficients and their statistical significance
When to use:
Contingency coefficients let you assess the strength of the relationship between two features recorded on a nominal scale. They are calculated for raw data or for data gathered in a contingency table.
How to set up the analysis
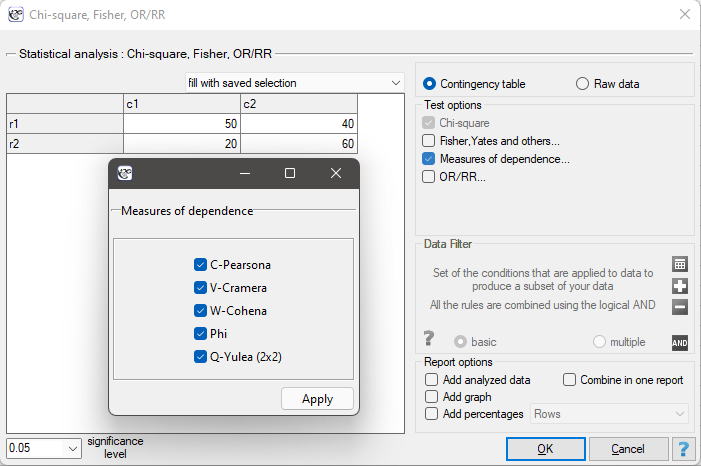
Statistics \(\to\) Nonparametric tests \(\to\) Chi-square, Fisher, OR/RR \(\to\) Measures of dependence... (or via the Wizard).
Definitions of measures
The Yule's \(Q\) contingency coefficient (Yule (1900)[184]) – a measure of dependence calculated for \(2\times2\) contingency tables. The value of \(Q\) lies in the range \(\langle-1;1\rangle\): the closer to 0, the weaker the relationship, and the closer to \(-1\) or \(+1\), the stronger the relationship (because of possible misinterpretation of a negative value, PQStat also presents the result as an absolute value). The coefficient is not very robust to small observed frequencies – when one of them is 0, it may incorrectly indicate a complete dependence between the features.
The \(\phi\) contingency coefficient – a measure of dependence recommended especially for \(2\times2\) tables, though it can be calculated for any table. The value of \(\phi\) lies in the range \(\langle0;1\rangle\): the closer to 0, the weaker the relationship, and the closer to 1, the stronger the relationship.
The Cramer's \(V\) contingency coefficient (Cramer (1946)[50]) – an extension of the \(\phi\) coefficient to \(r\times c\) tables. The value of \(V\) lies in the range \(\langle0;1\rangle\): the closer to 0, the weaker the relationship, and the closer to 1, the stronger the relationship. The value of \(V\) depends on the size of the table, so it should not be used to compare tables of different sizes.
The Cohen's \(W\) contingency coefficient (Cohen (1988)[47]) – a modification of the Cramer's \(V\) coefficient, calculable for \(r\times c\) tables. The value of \(W\) lies in the range \(\langle0;\max W\rangle\) (for tables in which at least one variable has only two categories, this range is \(\langle0;1\rangle\)). Like \(V\), it depends on the size of the table.
The Pearson's \(C\) contingency coefficient – a measure of dependence for \(r\times c\) tables. The value of \(C\) lies in the range \(\langle0;1)\), and its upper limit depends on the size of the table, which is why a version adjusted for table size, \(C_{adj}\), is also calculated, allowing comparisons between tables of different sizes.
Performing and interpreting the analysis
Example 1. (sex-exam.pqs file)
Consider a sample of 170 people (\(n=170\)) for whom we examine 2 features (\(X\)=sex, \(Y\)=passing the exam). Each of these features occurs in two categories (\(X_1\)=f, \(X_2\)=m, \(Y_1\)=yes, \(Y_2\)=no). Based on this sample, we would like to find out whether there is a relationship between sex and passing the exam in the population studied. The data distribution is shown in the contingency table:
| Observed frequencies | passing the exam | |||
| \(O_{ij}\) | yes | no | total | |
| sex | f | 50 | 40 | 90 |
| m | 20 | 60 | 80 | |
| total | 70 | 100 | 170 | |
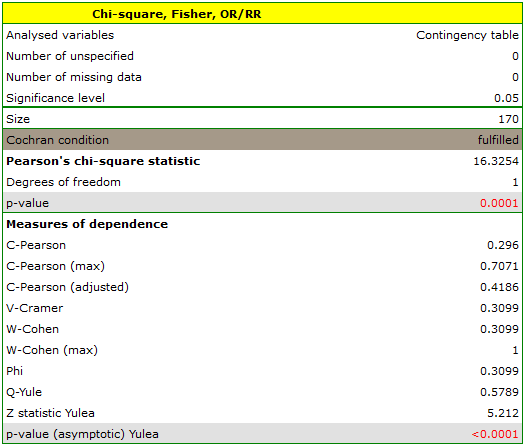
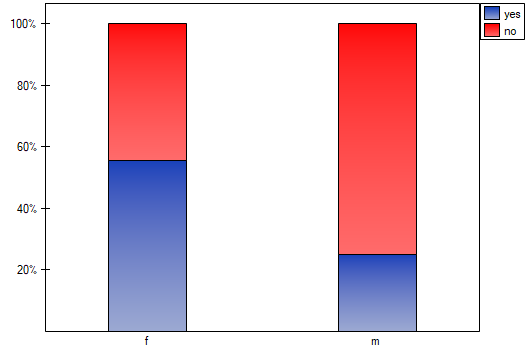
The value of the coefficients based on the \(\chi^2\) test, and thus the strength of the relationship between the analysed features, is as follows:
The Pearson's \(C_{adj}\) contingency coefficient = 0.42.
The Cramer's \(V\) = \(\phi\) = the Cohen's \(W\) = 0.31.
The Yule's \(Q\) contingency coefficient = 0.58, and the \(p\) value of the \(Z\) test performed, like the significance level of the \(\chi^2\) test, indicates the statistical significance of the relationship studied.
The Yule's \(Q\) contingency coefficient
where \(O_{11}, O_{12}, O_{21}, O_{22}\) – observed frequencies in the contingency table.
The statistical significance of the calculated Yule's \(Q\) coefficient is determined using a \(Z\) test.
Hypotheses:
\( \begin{array}{cl} \mathcal{H}_0: &Q=0,\\ \mathcal{H}_1: &Q\neq 0. \end{array} \)
The test statistic is defined by:
The test statistic asymptotically (for large sample sizes \(n\)) has the normal distribution.
The \(p\) value, determined on the basis of the test statistic, is compared with the significance level \(\alpha\): if \(p \le \alpha\), we reject \(\mathcal{H}_0\) in favor of \(\mathcal{H}_1\); if \(p > \alpha\), there is no reason to reject \(\mathcal{H}_0\).
The \(\phi\) contingency coefficient
where \(\chi^2\) – the value of the \(\chi^2\) test statistic, \(n\) – the total frequency in the contingency table.
The Cramer's \(V\) contingency coefficient
where \(\chi^2\) – the value of the \(\chi^2\) test statistic, \(n\) – the total frequency in the table, and \(w'\) – the smaller of the two values \(r\) and \(c\).
The Cohen's \(W\) contingency coefficient
where \(\chi^2\) – the value of the \(\chi^2\) test statistic, \(n\) – the total frequency in the table, and \(w'\) – the smaller of the two values \(r\) and \(c\).
The Pearson's \(C\) contingency coefficient
where \(\chi^2\) – the value of the \(\chi^2\) test statistic, \(n\) – the total frequency in the table. The upper limit that the \(C\) coefficient can reach for a given table size is given by the formula:
where \(w'\) – the smaller of the two values \(r\) and \(c\). The version adjusted for table size: