 PQStat
The Relative Risk and the Odds Ratio
When to use these measures:
The Odds Ratio and the Relative Risk are used when we want to check how exposure to some factor (e.g. cigarette smoking) is related to the occurrence of an analysed phenomenon (e.g. a disease) – in other words, how much greater (or smaller) the odds or risk of the phenomenon occurring is in the exposed group compared to the unexposed group. Both measures are calculated on the basis of data collected in a \(2\times2\) contingency table.
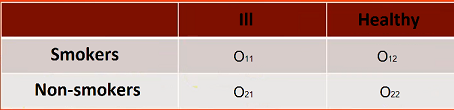
If the study is a case-control study (usually retrospective – the researcher decides on the sample size in which the phenomenon occurs, and on the control sample, free of the phenomenon), the Odds Ratio is calculated. If the study is a cohort study (usually prospective – the researcher ensures that the structure of the phenomenon's occurrence in the sample is close to its structure in the population), the Relative Risk is calculated.
How to set up the analysis
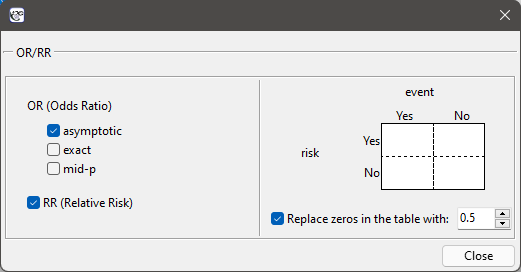
Statistics \(\to\) NonParametric tests \(\to\) Chi-square, Fisher, OR/RR, option OR/RR... (or via the Wizard).
Definitions of measures
Odds Ratio (OR) (ang. Odds Ratio) – indicates how many times greater (or smaller) the odds of the analysed phenomenon occurring in the group exposed to the risk factor are compared to the unexposed group. It is calculated for case-control studies.
Relative Risk (RR) (ang. Relative Risk) – indicates how many times greater (or smaller) the risk of the analysed phenomenon occurring in the group exposed to the risk factor is compared to the unexposed group. It is calculated for cohort studies.
When interpreting the significance of either measure, we often use its confidence interval – we then check whether the interval contains the value 1 (no difference between groups). We can also compare the \(p\) value of the significance test (see "For those interested") with the assumed significance level \(\alpha\): when \(p \le \alpha\), the difference is statistically significant.
The odds ratio (\(2\times 2\) table)
Formulas:
The odds of being a case in the exposed group and in the unexposed group are calculated according to the formulas:
The Odds Ratio:
The test of significance for the \(OR\) verifies the hypothesis that the odds of the analysed phenomenon occurring are the same in the exposed and unexposed groups.
Hypotheses:
\(\begin{array}{cl} \mathcal{H}_0: & OR = 1, \\ \mathcal{H}_1: & OR \ne 1. \end{array}\)
Formulas:
The test statistic is defined by:
where \(SE=\sqrt{\frac{1}{O_{11}}+\frac{1}{O_{12}}+\frac{1}{O_{21}}+\frac{1}{O_{22}}}\) – standard error of \(\ln(OR)\). This statistic asymptotically (for large sample sizes) has the normal distribution.
The relative risk (\(2\times 2\) table)
Formulas:
The estimated risk of the analysed phenomenon occurring is defined by the formula \(R=\frac{O_{11}+O_{21}}{n}\), and the Relative Risk:
The test of significance for the \(RR\) verifies the hypothesis that the risk of the analysed phenomenon occurring is the same in the exposed and unexposed groups.
Hypotheses:
\(\begin{array}{cl} \mathcal{H}_0: & RR = 1, \\ \mathcal{H}_1: & RR \ne 1. \end{array}\)
Formulas:
The test statistic is defined by:
where \(SE=\sqrt{\frac{1}{O_{11}}-\frac{1}{O_{11}+O_{12}}+\frac{1}{O_{21}}-\frac{1}{O_{21}+O_{22}}}\) – standard error of \(\ln(RR)\). This statistic asymptotically (for large sample sizes) has the normal distribution.