 PQStat
Matching groups
When to use:
If we estimate the treatment effect from a fully randomized experiment, then by randomly assigning subjects to the treated and untreated groups, we create groups that are similar in terms of possible confounding factors. The similarity of the groups is due to the random assignment itself. In such studies, we can examine the pure (independent of confounding factors) effect of the treatment method on the outcome of the experiment. In this case, matching the groups by any means other than random assignment is not necessary.
The possibility of error arises when the difference in treatment outcome between the treated and untreated groups may be due not to the treatment itself, but to a factor that induced people to take part in the treatment. This happens when, for some reason, randomization is not possible, e.g. it is an observational study, or for ethical reasons we cannot assign treatment arbitrarily. In such cases, artificial group matching may be applicable. For example, if the people we assign to the treatment group are healthier, and the people in the control group have a more severe form of the disease, then it is not the treatment method itself but the patient's condition before treatment that may affect the outcome of the experiment. When we see such an imbalance between groups, it is good if we can decide to randomize – this solves the problem, since randomly assigning people to groups makes them similar. However, we can imagine a different situation. This time, the group we are interested in will not be people undergoing treatment but smokers, and the control group will be non-smokers, and the analyses will aim to show the adverse effect of smoking on the occurrence of lung cancer. Then, wanting to check whether smoking genuinely increases the risk of developing the disease, it would be unethical to conduct a fully randomized trial, since it would mean forcing people randomly selected into the risk group to smoke. The solution to this situation is to establish an exposed group, i.e. to draw a certain number of people from among those who already smoke, and then select a control group made up of non-smokers. The control group should be selected, since leaving the selection to chance may result in a non-smoking group that is younger than the smokers merely because smoking is becoming less fashionable in our country, so there are automatically many young people among non-smokers. The control group should be drawn from non-smokers, but in such a way that it is as similar as possible to the treatment group. In this way, we come closer to examining the pure (independent of selected confounding factors, such as age) effect of smoking/non-smoking on the outcome of the experiment, i.e. in this case the occurrence of lung cancer. Such a selection can be made precisely through the matching offered by the program.
One of the main advantages of researcher-controlled matching is that the control group becomes more similar to the treatment group, but this is also the greatest weakness of this method. It is an advantage because our study increasingly resembles a randomized study – in a randomized trial, the study and control groups are similar with respect to almost all features, including those we are not studying (the random assignment provides this similarity). As a result of applying researcher-controlled matching, the treatment and control groups become similar only with respect to selected features.
Assumptions
- the features with respect to which matching is performed should be measured for all objects in both groups,
- the group from which the match is drawn (usually the control group) should be sufficiently large and contain objects genuinely similar to the treatment group.
Definitions of measures
The first two methods listed below are based on matching groups through Propensity Score Matching (PSM). This type of matching was proposed by Rosenbaum and Rubin[141]. In practice, it is a technique for matching a control group (untreated or minimally/standardly treated subjects) to a treatment group, based on a probability describing the subjects' propensity to be assigned to treatment depending on the observed associated variables. The probability score describing this propensity, referred to as the Propensity Score, is a balancing score, so that as a result of matching the control group to the treatment group, the distribution of the measured associated variables becomes more similar between treated and untreated subjects. The third method does not determine the probability for each individual, but determines a distance/dissimilarity matrix that indicates the objects that are closest/most similar with respect to multiple selected features.
Given probability – i.e. a value between 0 and 1 given for each person studied, describing the probability of belonging to the treatment group, i.e. the Propensity Score. Such a probability can be determined beforehand using various methods, e.g. a logistic regression model, neural networks, or many other methods. If a person from the group from which we draw the control obtains a Propensity Score similar to that obtained by a person from the treatment group, they can enter the analysis, since the two individuals are similar with respect to the features that were considered when determining the Propensity Score.
Determined from a logistic regression model – since logistic regression is the most commonly used matching method, PQStat provides the ability to automatically determine the Propensity Score value in the analysis window based on this method. The matching then proceeds using the Propensity Score obtained in this way.
Similarity/distance matrix – with this option, no Propensity Score value is determined; instead, a matrix is built indicating the distance of each person in the treatment group to a person in the control group. The user can set boundary conditions, e.g. specify that the person matched to a given person from the study group cannot differ from them by more than 3 years of age and must be of the same sex. Distances in the constructed matrix are determined based on any metric or method describing dissimilarity. This way of matching the control group to the treated group is very flexible – besides the free choice of how distances/dissimilarity are determined, many metrics allow the indication of weights specifying how important each variable is to the researcher. However, great caution is advised when choosing a distance/dissimilarity matrix – many features and many ways of determining distances require prior standardization or normalization of the data, and choosing the inverse of distance or similarity (instead of dissimilarity) may result in finding the most distant and dissimilar objects, whereas we normally use these methods to find similar objects. If the researcher has no specific reason to change the metric, it is standard practice to use statistical distance, i.e. the Mahalanobis metric – it is the most universal, does not require prior standardization of the data, and is robust to correlation between variables. A more detailed description of the distances and dissimilarity/similarity measures available in the program, and how to interpret the results obtained, can be found in the Similarity matrix section.
In practice, there are many methods for indicating how close the compared objects are. Two are proposed in the program:
Nearest neighbour method – a standard way of selecting objects, not only with a similar Propensity Score, but also those whose distance/dissimilarity in the matrix is smallest.
Nearest neighbour method, closer than... – works the same way as the nearest neighbour method, with the difference that only objects that are close enough can be matched. The limit of this closeness is set by giving a value describing the threshold beyond which objects are so dissimilar to the objects studied that we do not want to give them a chance to join the newly built control group. When the analysis is based on the Propensity Score or on a matrix defined by dissimilarity, the most dissimilar objects are those at a distance of 1, and the most similar are those at a distance of 0 – when choosing this method, we should give a value closer to 0 when matching more restrictively, or closer to 1 when the threshold is placed further away. When distances rather than dissimilarities are determined in the matrix, the minimum value is still 0, but the maximum value is not predetermined.
We can match without replacing objects already drawn, or with replacement of these objects back into the group from which we are drawing.
Matching without replacement – when matching without replacement is used, once an untreated person has been selected to be matched to a given treated person, that untreated person is no longer available for consideration as a potential match for subsequent treated persons. As a result, each untreated person is included in at most one matched set.
Matching with replacement – matching with replacement allows a given untreated person to be included more than once in a single matched set. When matching with replacement is used, subsequent analyses, in particular the estimation of variance, must take into account the fact that the same untreated person may appear in multiple matched sets.
When it is not possible to match an untreated person to a treated one, because there are no more people left to join in the group from which we are choosing (e.g. matching persons have already been joined to other treated persons, or the set from which we are choosing has no similar persons), that person remains without a pair.
Most often, 1:1 matching is performed, i.e. for one treated person, one untreated person is matched. However, if the original control group from which we draw is large enough and we need to draw more individuals, 1:k matching can be chosen, where k indicates the number of individuals that should be matched to each treated individual.
Evaluation of the matching
After matching the control group to the treatment group, the results of such matching can be returned to the worksheet, i.e. a new control group can be obtained. However, it should not be assumed that applying matching will always yield satisfactory results – in many situations, the group from which we draw does not have enough objects that are sufficiently similar to the treatment group. Therefore, the matching performed should always be evaluated. There are many methods for evaluating the matching of groups. The program uses methods based on the standardized difference between groups, described more extensively in, among others, the work of P.C. Austin[13][14]. This approach allows comparison of the relative balance of variables measured in different units, and its result is not affected by sample size. The estimation of agreement using statistical tests was abandoned, since the matched control group is usually much smaller than the original control group, so the resulting \(p\) values of tests comparing the study group to the smaller control group more often remain consistent with the null hypothesis, and thus do not show significant differences due to the reduced sample size.
The 1:1 matching obtained in reports means the summary for the study group and the corresponding control group obtained in the first matching; the 1:2 matching means the summary for the study group and the corresponding control group obtained in the first + second matching (i.e. it does not refer to the study group and the corresponding control group obtained only in the second matching), etc.
How to set up the analysis
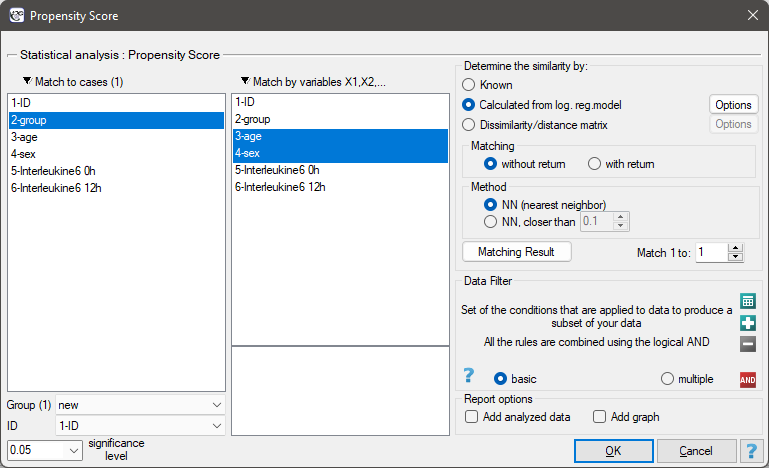
Advanced statistics \(\to\) Multivariate models \(\to\) Matching groups.
Performing and interpreting the analysis
Example 1. (matching.pqs file)
We want to compare two ways of treating patients after accidents: the traditional way and a new way. The correct effect of both treatments should be observed as a decreasing level of selected cytokines. To compare the effectiveness of these two treatments, both should be carried out on patients who are quite similar – then we can be sure that any differences in the effectiveness of these methods will result from the treatment effect itself and not from other differences between patients assigned to different groups. The study is conducted a posteriori, that is, it is based on data collected from patients' treatment histories. Therefore, the researchers had no influence on the assignment of patients to the group treated with the new drug and the group treated traditionally. It was noted that the traditional treatment was mainly prescribed to older patients, while the new treatment was prescribed to younger patients, in whom it is easier to lower cytokine levels. The groups were fairly similar in terms of sex structure, but not identical.
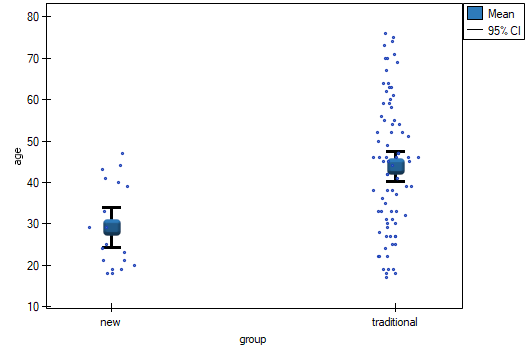
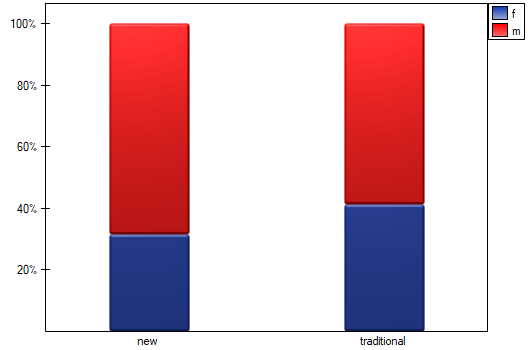
If the planned study had been carried out on such selected groups of patients, the new treatment would have had an easier task, since younger organisms might respond better to treatment. The conditions of the experiment would not be equal for both treatments, which could distort the results of the analyses and the conclusions drawn. It was therefore decided to select the traditionally treated group so that it would be similar to the study group treated with the new method.
We plan to perform the matching with respect to two features, i.e. age and sex. The traditionally treated group is larger (80 patients) than the group treated with the new drug (19 patients), so there is a good chance that we will be able to select groups that are similar. The random selection is performed using the logistic regression model algorithm built into PSM. We remember that sex must be coded numerically, since only numerical values are used in logistic regression analysis. We choose the nearest neighbour as the method. We want the same person to be unable to be selected twice, so we choose matching without replacement. We will try 1:1 matching, i.e. for each person treated with the new drug we will match one person treated traditionally. Remember that the selection is random, and so depends on the random seed value set by our computer, so the draw performed by the reader may differ from the values presented here.
We can view the summary of the selection in tables and graphs.
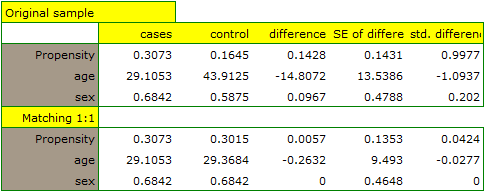
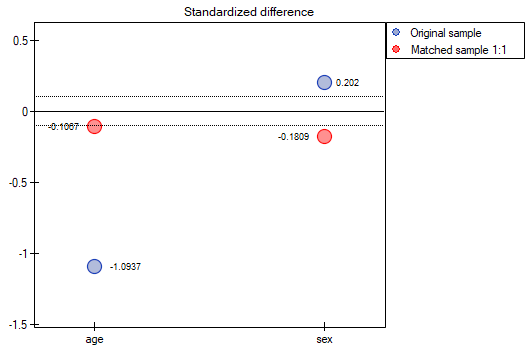
In the original sample, the mean age is more than 14 years higher in traditionally treated patients (the difference between the means is 14.8072), while the sex structure differs by less than 10% (0.0967). Much smaller differences are observed between patients treated with the new method and the traditionally treated patients matched to them. We obtain the most information about the quality of the matching from the standardized differences (the last column of the table and the graph).
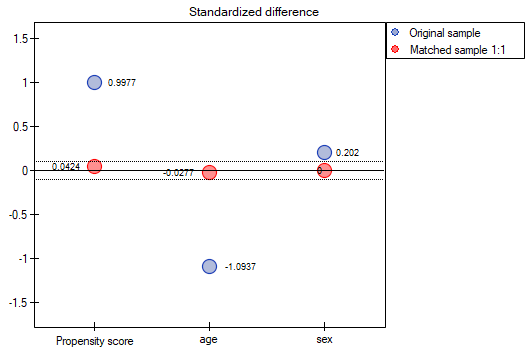
The line at 0 indicates group equilibrium (a difference between groups equal to 0). When the groups are in equilibrium with respect to the given features, all points on the graph lie close to this line, i.e. around the interval from -0.1 to 0.1. In the case of the original sample (blue colour), we see a considerable departure of the Propensity Score – as we know, this mismatch results mainly from the age mismatch (its standardized difference lies at a large distance from 0), and to a lesser extent from the sex mismatch. By performing the matching, we obtained groups more similar to each other (red colour on the graph). The age of both groups is now similar – the traditionally treated group differs from the group treated with the new method by less than a year on average (the difference between the means shown in the table is 0.2632). In the case of sex, the match is perfect, i.e. the proportion of women and men is the same in both groups. We can return the data prepared in this way to the worksheet and subject it to the analyses we have planned.
Looking at the summary we have just obtained, we can see that despite the good balancing of the groups and the perfect matching of many individuals, there are individual people who are not as similar to each other as we might expect.
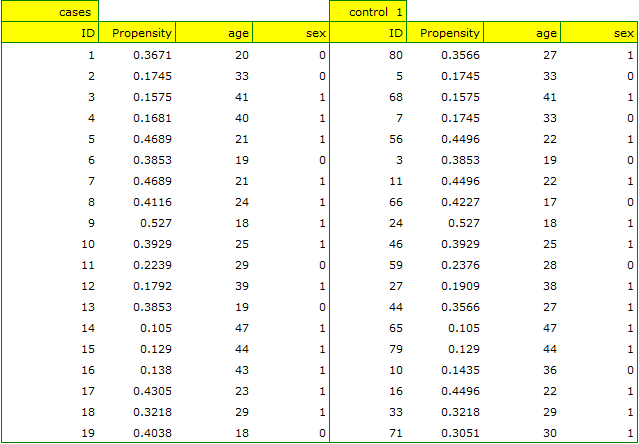
Sometimes, besides obtaining well-balanced groups, researchers want to determine precisely how individual people are selected, i.e. to gain greater control over the similarity of objects with respect to the Propensity Score value, or the similarity of objects with respect to the values of specific features. In such a case, if the group from which we draw is large enough, the analysis may yield results more favourable from the researcher's point of view; but if the group from which we draw lacks objects meeting our criteria, then for some individuals it will not be possible to find a match meeting our conditions.
Variant 1: strict Propensity Score criterion
Suppose we would like to obtain such groups whose Propensity Score (i.e. propensity to take part in the study) differs by no more than a given value. How do we determine this value? We can look at the report from the earlier analysis, where the smallest and largest distance between the drawn objects is given.

In our case, the closest objects differ by min=0, and the furthest by max=0.5183. Let us therefore try to check what kind of selection we obtain when we match, to people treated with the new method, people treated traditionally whose Propensity Score is very close, e.g. less than 0.01.
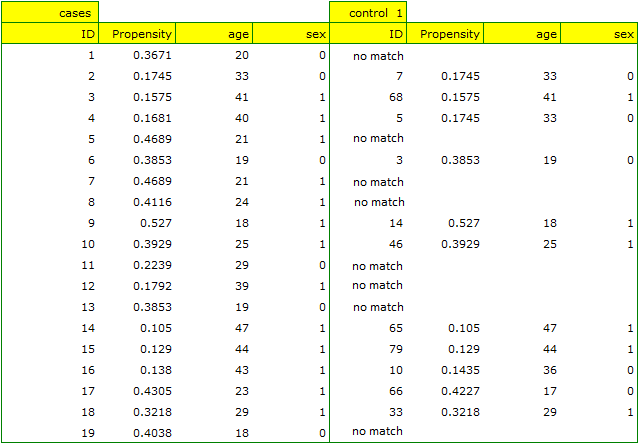
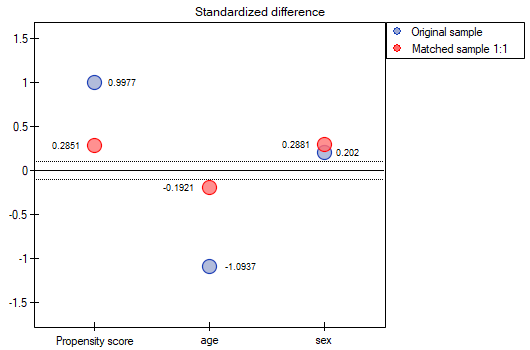
We can see that this time we failed to select the whole group. Comparing the Propensity Score for each pair (treated with the new drug and treated traditionally), we can see that the differences are indeed small. However, since the matched group is now much smaller, summarising the whole selection process, we must note that the Propensity Score, age, and sex are not close enough to the line at 0. Our attempt to improve the situation did not lead to the desired effect, and the resulting groups are not sufficiently well balanced.
Variant 2: Mahalanobis distance matrix
Suppose we wanted to obtain pairs (people treated with the new method and people treated traditionally) who are of the same sex and whose ages do not differ by more than 3 years. In the Propensity Score-based matching, we did not have this kind of ability to control the extent of agreement of each variable. For this purpose, we will use a different method, not based on the Propensity Score but on distance/dissimilarity matrices. After selecting the Options button, we select the proposed Mahalanobis statistical distance matrix and set the neighbourhood matching to a maximum distance of 3 for age and 0 for sex. As a result, for two people no match could be found, but the remaining matches meet the set criteria.
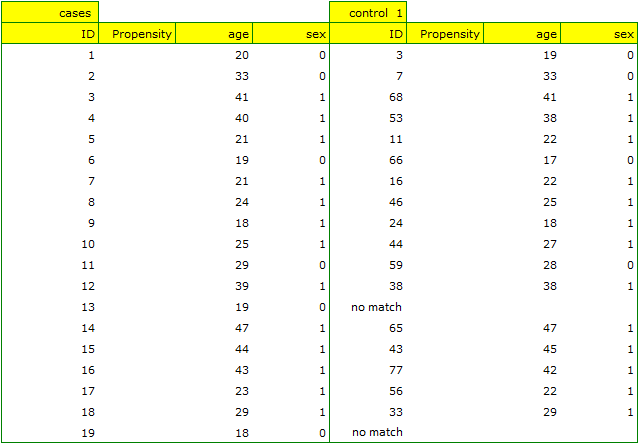
Summarising the whole draw, we must note that although it satisfies our assumptions, the resulting groups are not as well balanced as in our first draw, based on the Propensity Score. The points marked in red, representing the quality of the matching in terms of age and the quality of the matching in terms of sex, deviate somewhat from the line of identity set at level 0, which means the average difference in age and sex structure is now greater than in the first matching.
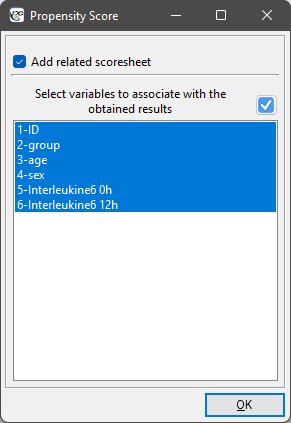
It is up to the researcher to decide which way of preparing the data will be more advantageous for them. Ultimately, once a decision has been made, the data can be returned to a new worksheet. To do this, we go back to the report we have chosen and, in the project tree, right-click and select the Redo analysis menu. In the same analysis window, we select the Matching result button and specify which additional variables should be returned to the new worksheet.
As a result, we obtain a new data sheet in which, side by side, we find the data of people treated with the new method and the traditionally treated people matched to them.
Formulas
For comparing continuous variables, we determine the standardized mean difference:
where:
\(\bar{x}_{treated}\), \(\bar{x}_{control}\) – the mean value of the variable in the treatment group and the mean value of the variable in the control group,
\(sd^2_{treated}\), \(sd^2_{control}\) – the variance in the treatment group and the variance in the control group.
For comparing binary variables (with two categories, usually 0 and 1), we determine the standardized frequency difference:
where:
\(\hat{p}_{treated}\), \(\hat{p}_{control}\) – the frequency of the value described as 1 in the treatment group and the frequency of the value described as 1 in the control group.
Procedure: variables with multiple categories should be broken down, in logistic regression analysis, into dummy variables with two categories, and, by checking the match of both groups, the standardized frequency difference should be determined for them.