 PQStat
Evaluation of a diagnostic test
When to use:
Suppose that with the help of a diagnostic test we examine the occurrence of a given feature (most often a disease), and we know the reality (the so-called gold standard), i.e. we know whether this feature actually occurs in the people studied. On the basis of this information, we can build a \(2\times2\) contingency table:
| Observed frequencies | Reality (gold standard) | |||
| disease (+) | disease free (–) | Total | ||
| diagnostic test | positive result (+) | TP | FP | TP+FP |
| negative result (–) | FN | TN | FN+TN | |
| Total | TP+FN | FP+TN | n=TP+FP+FN+TN | |
where:
TP – true positive results,
FP – false positive results,
FN – false negative results,
TN – true negative results.
For such a table, we can calculate the measures given below.
Definitions of measures
Sensitivity – describes the ability to detect people who are genuinely ill (who have a given feature). If we examine a group of ill people, sensitivity tells us what percentage of them have a positive test result.
Specificity – describes the ability to detect people who are genuinely healthy (without a given feature). If we examine a group of healthy people, specificity tells us what percentage of them have a negative test result.
Positive predictive value (\(PPV\)) – the probability that a person has the disease, given a positive test result. So if the person examined obtains a positive test result, \(PPV\) tells them how confident they can be that they have the disease.
Negative predictive value (\(NPV\)) – the probability that a person does not have the disease, given a negative test result. So if the person examined obtains a negative test result, \(NPV\) tells them how confident they can be that they do not have the disease. Positive and negative predictive values depend on the prevalence of the disease.
Prevalence – the probability of the disease occurring in the population for which the diagnostic test was carried out.
Likelihood ratio of a positive test (\(LR_+\)) – this measure allows the fit of the results of several tests to the gold standard to be compared, and does not depend on the prevalence of the disease. It is the ratio of two odds: the odds that a positive test result is obtained by a person from the group of ill people, to the odds that the same result is observed among healthy people.
Likelihood ratio of a negative test (\(LR_-\)) – the ratio of two odds: the odds that a negative test result is obtained by a person from the group of ill people, to the odds that the same result is observed among healthy people.
Accuracy (\(Acc\)) – the probability of a correct diagnosis using the diagnostic test. So if the person examined obtains a positive or negative test result, \(Acc\) tells them how confident they can be in the diagnosis made.
Diagnostic Odds Ratio (\(DOR\)) – the ratio of two odds: the odds of a positive test result for an ill person, to the odds of a positive test result for a healthy person.
How to set up the analysis
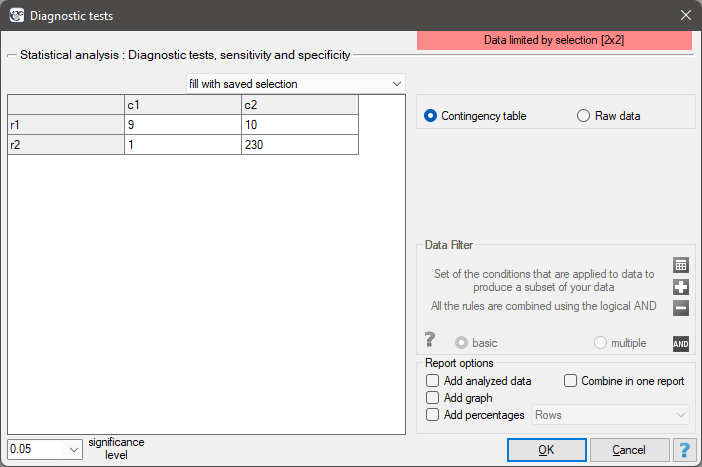
Advanced statistics \(\to\) Diagnostic tests \(\to\) Diagnostic reliability.
Performing and interpreting the analysis
Example 1. (mammography.pqs file)
Mammography is one of the most widely used screening tests for detecting breast cancer. The study below was carried out on a group of 250 so-called “asymptomatic” women aged 40 to 50. Mammography can detect a cancer focus smaller than 5 mm, and also lets changes be identified that are not yet a nodule, but only a change in tissue structure. An example result of a mammography examination is shown below.
| Observed frequencies | Reality (histopathology) | |||
| disease (+) | disease free (–) | Total | ||
| diagnostic test | positive result (+) | 9 | 10 | 19 |
| negative result (–) | 1 | 230 | 231 | |
| Total | 10 | 240 | 250 | |
We will determine the values allowing us to evaluate the diagnostic test performed.
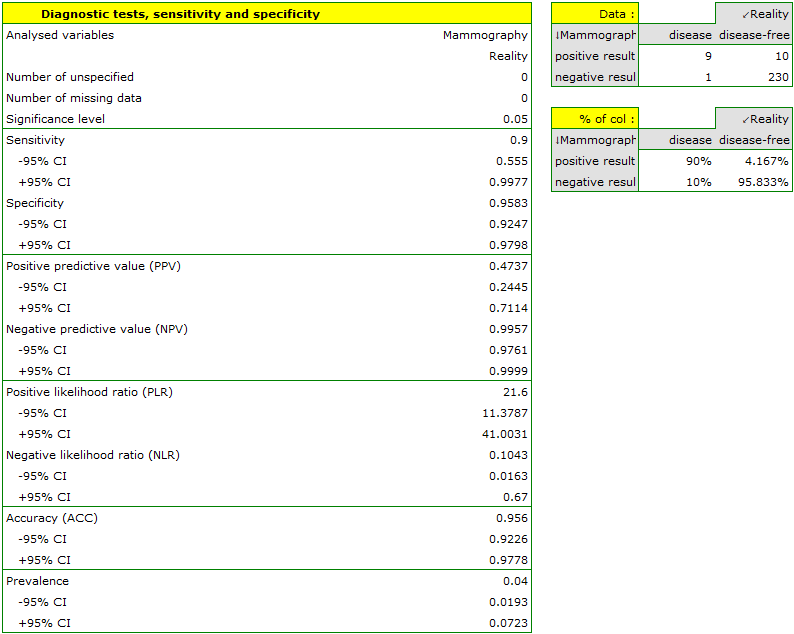
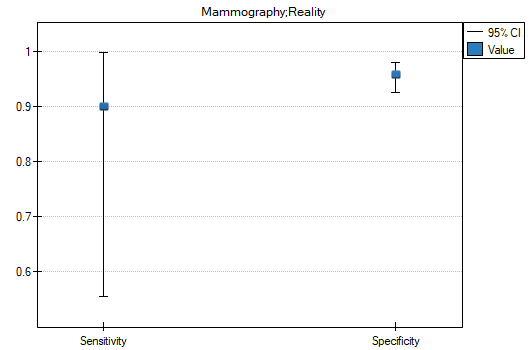
Interpretation of the individual measures:
- 90% of women with breast cancer were correctly diagnosed, i.e. obtained a positive mammography result;
- 95.83% of healthy women (without breast cancer) were correctly diagnosed, i.e. obtained a negative mammography result;
- 4 out of every 100 women examined suffer from breast cancer;
- a woman who obtains a positive mammography result can be 47.37% sure that she has breast cancer;
- a woman who obtains a negative mammography result can be 99.57% sure that she does not have breast cancer;
- the odds that a positive mammography result is obtained by a woman who genuinely has cancer is 21.60 times greater than the odds that a positive mammography result is obtained by a woman who is genuinely healthy;
- the odds that a negative mammography result is obtained by a woman who genuinely has cancer amounts to 10.43% of the odds that a negative mammography result is obtained by a woman who is genuinely healthy;
- a woman undergoing mammography (regardless of the result obtained) can be 96.50% confident in the diagnosis made;
- the odds of a positive test result for a woman who genuinely has breast cancer are 207 times greater than the odds of such a result for a healthy woman.
Sensitivity
Specificity
Positive predictive value
Negative predictive value
Prevalence
Likelihood ratio of a positive test
The confidence interval for \(LR_+\) is built on the basis of the standard error:
Likelihood ratio of a negative test
The confidence interval for \(LR_-\) is built on the basis of the standard error:
Accuracy
Diagnostic Odds Ratio
The confidence interval for \(DOR\) is built on the basis of the standard error: