 PQStat
Comparison of correlation coefficients
When to use this test:
The \(t\)-test for checking the equality of Pearson product-moment correlation coefficients coming from 2 independent populations lets you check whether two Pearson product-moment correlation coefficients (\(R_{p_1}\), \(R_{p_2}\)), determined in two different populations, are equal.
Assumptions
- the coefficients \(r_{p_1}\) and \(r_{p_2}\) come from 2 samples drawn from independent populations,
- the coefficients \(r_{p_1}\) and \(r_{p_2}\) examine the relationship between the same features \(X\) and \(Y\),
- the sizes of both samples \(n_1\) and \(n_2\) are known.
How to set up the analysis
Statistics \(\to\) Parametric tests \(\to\) comparison of dependence coefficients.
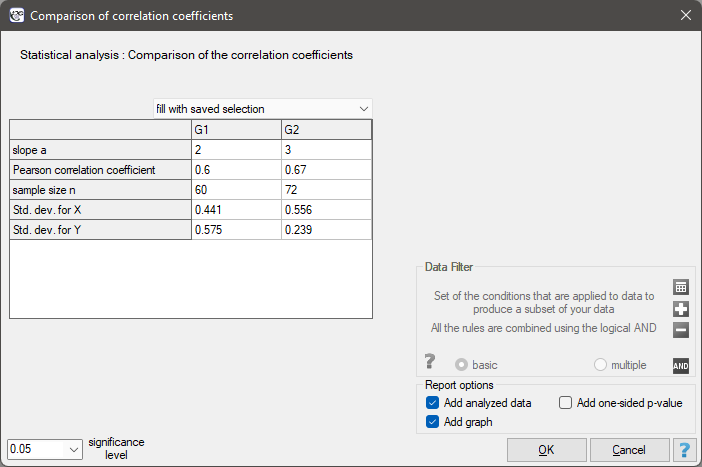
Hypotheses:
\(\begin{array}{cl} \mathcal{H}_0: & R_{p_1} = R_{p_2}, \\ \mathcal{H}_1: & R_{p_1} \ne R_{p_2}. \end{array}\)
Formulas: the test statistic is defined by:
where:
\(\displaystyle z_{r_{p_1}}=\frac{1}{2}\ln\left(\frac{1+r_{p_1}}{1-r_{p_1}}\right)\),
\(\displaystyle z_{r_{p_2}}=\frac{1}{2}\ln\left(\frac{1+r_{p_2}}{1-r_{p_2}}\right)\).
The test statistic has the \(t\)-Student distribution with \(n_1+n_2-4\) degrees of freedom.
The \(p\) value, determined on the basis of the test statistic, is compared with the significance level \(\alpha\): if \(p \le \alpha\), we reject \(\mathcal{H}_0\) in favor of \(\mathcal{H}_1\); if \(p > \alpha\), there is no reason to reject \(\mathcal{H}_0\).
Comparison of the slope of regression lines
When to use this test:
The \(t\)-test for checking the equality of linear regression coefficients coming from 2 independent populations lets you check whether two linear regression coefficients \(\beta_1\) and \(\beta_2\), determined in the two populations studied, are equal.
Assumptions
- the coefficients \(\beta_1\) and \(\beta_2\) come from 2 samples drawn from independent populations,
- the coefficients \(\beta_1\) and \(\beta_2\) examine the relationship between the same features \(X\) and \(Y\),
- the sizes of both samples \(n_1\) and \(n_2\) are known,
- the standard deviations of the values of both features in both samples are known: \(sd_{x_1}, sd_{y_1}\) and \(sd_{x_2}, sd_{y_2}\),
- the Pearson product-moment correlation coefficients of both samples are known: \(r_{p_1}\) and \(r_{p_2}\).
How to set up the analysis
The settings window is shared with the test for comparing correlation coefficients (see the screenshot above) – in the comparison of dependence coefficients window, indicate the slope coefficients of the regression lines instead.
Hypotheses:
\(\begin{array}{cl} \mathcal{H}_0: & \beta_1 = \beta_2, \\ \mathcal{H}_1: & \beta_1 \ne \beta_2. \end{array}\)
Formulas: the test statistic is defined by:
where:
\(\displaystyle s_{yx_1}=sd_{y_1}\sqrt{\frac{n_1-1}{n_1-2}(1-r_{p_1}^2)}\),
\(\displaystyle s_{yx_2}=sd_{y_2}\sqrt{\frac{n_2-1}{n_2-2}(1-r_{p_2}^2)}\).
The test statistic has the \(t\)-Student distribution with \(n_1+n_2-4\) degrees of freedom.
The \(p\) value, determined on the basis of the test statistic, is compared with the significance level \(\alpha\): if \(p \le \alpha\), we reject \(\mathcal{H}_0\) in favor of \(\mathcal{H}_1\); if \(p > \alpha\), there is no reason to reject \(\mathcal{H}_0\).