 PQStat
ANCOVA
When to use:
Analysis of covariance (ANCOVA) is a method for testing the hypothesis that the means of two or more populations are equal, after adjusting for other continuous variables. These adjustments produce effects that researchers tend to find more appealing than those obtained through ANOVA, i.e. narrower confidence intervals and greater statistical power.
Suppose an experiment is carried out to evaluate the effects of two treatments. The groups to which the treatments were randomly assigned differ slightly in mean age, which also affects the treatment outcome. Differences between the groups in outcomes would be quite ambiguous to interpret, since the groups differ both in age and in treatment conditions. Analysis of covariance provides "adjusted means", which estimate what the mean outcomes would be if the groups were exactly identical in terms of age. At the same time, the within-group variability in outcomes attributable to the variable (age) is removed from the error variability, increasing the precision of the test of differences between the adjusted means.
The label "analysis of covariance" is now regarded as somewhat anachronistic by some research methodologists and statisticians, since this analysis is not a separate technique but a variant of the general linear model (GLM). Nevertheless, the term remains useful, since it immediately conveys to most researchers the idea that a categorical variable (e.g. treatment condition) and a continuous variable (e.g. age) are both involved in a single analysis determining the treatment outcome.
Assumptions
- the dependent variable \(Y\) is measured on an interval scale,
- the samples come from a normally distributed population (normality of the variables, or of the model residuals),
- an independent model with respect to the factors,
- equality of variance of the residuals between the groups formed by the factors,
- equal slopes of the regression lines (the regression coefficients between each confounding variable and the dependent variable) for every possible level of the factor.
Equality of the slopes of the regression lines is tested using an F test comparing the model containing the analysed factors with the same model extended to include interactions with the confounding factors. A statistically significant result means that the assumption of equal slopes has been violated, because the interaction becomes significant, indicating different slopes of the lines.
How to set up the analysis
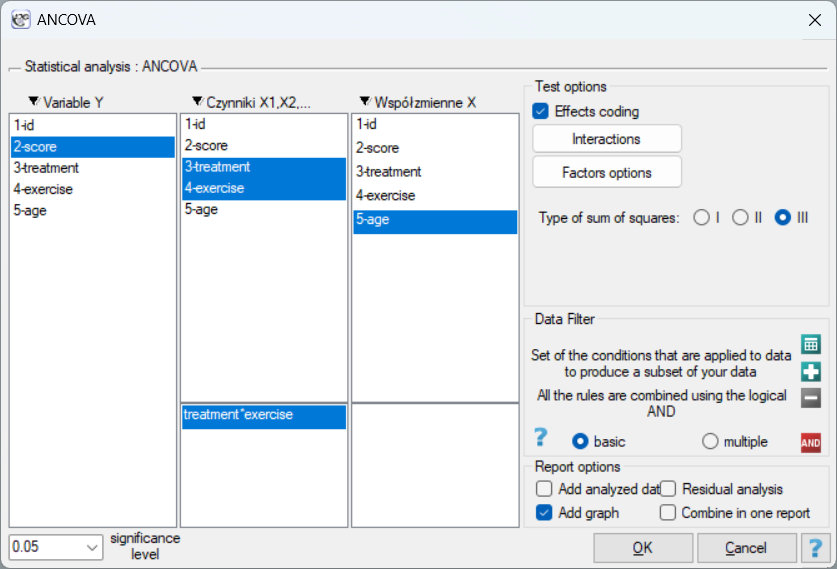
Advanced statistics \(\to\) Multivariate models \(\to\) ANCOVA.
Performing and interpreting the analysis
Example 1. (drug_cholesterol.pqs file)
Imagine that a researcher was conducting a study of a new cholesterol-lowering drug. The study was designed so that the drug dose occurred at three levels: high, low, and placebo. The researcher checked (using an independent ANOVA) whether cholesterol after treatment differed depending on the dose of the drug.
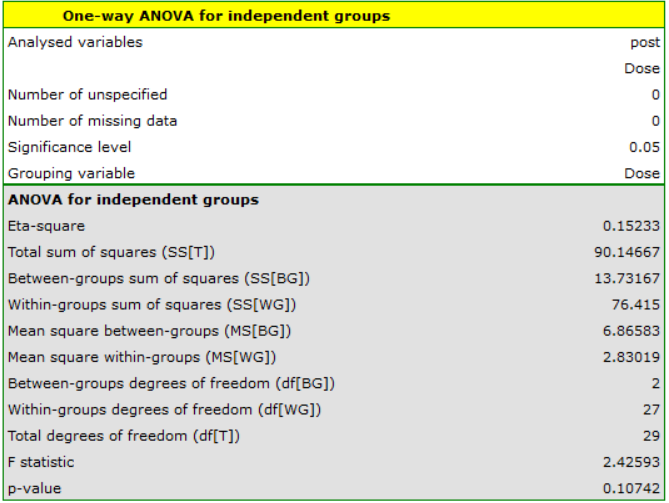
Unfortunately, the researcher found no confirmation of differences between the results. Suppose the researcher then realized that whether a given drug changes cholesterol levels might be related to the patient's baseline cholesterol level and to their age. For this reason, they decided to perform a one-way ANCOVA (with drug dose as the factor), including pre-treatment cholesterol level and age as covariates.
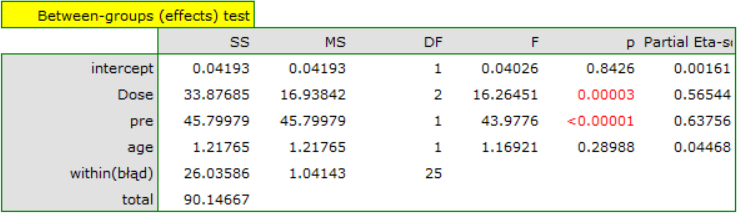
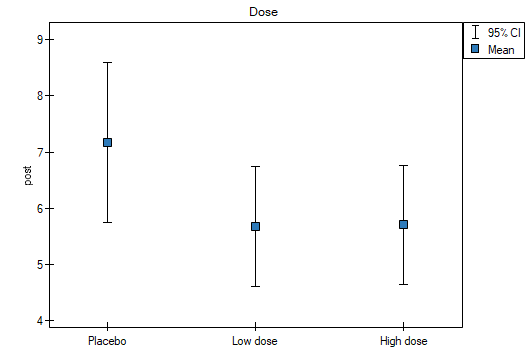
Including the pre-treatment cholesterol level reduced the errors obtained for the means and narrowed the confidence intervals. To display the observed or expected means, we choose the appropriate settings via Factor options, checking the error plot. The first plot shows the observed means with their confidence interval, i.e. not accounting for the effect of age and pre-treatment cholesterol level; the second plot shows the means expected from the fitted model, together with their confidence intervals, i.e. after accounting for the effect of these two covariates:
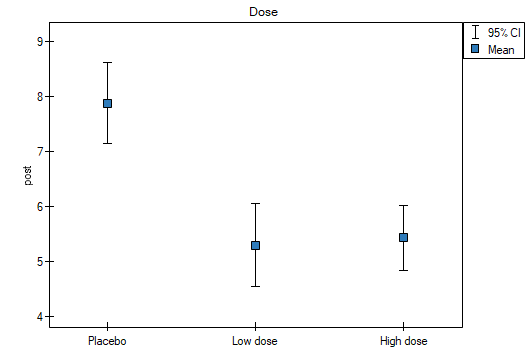
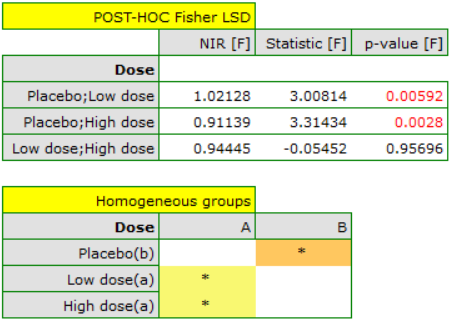
As a result, by accounting for pre-treatment cholesterol level, the researcher was able to demonstrate the effectiveness of the new treatment. Pre-treatment cholesterol level and age explain part of the change in cholesterol level after treatment, but the remaining part of the change – 57% – can be attributed to the drug dose used (partial Eta-squared = 0.565437). Post-hoc tests (selected via Factor options) suggested the formation of two homogeneous groups: the placebo group and the group of patients receiving the drug, indicating that raising the dose to the high level makes no difference, since the cholesterol levels obtained would be similar.
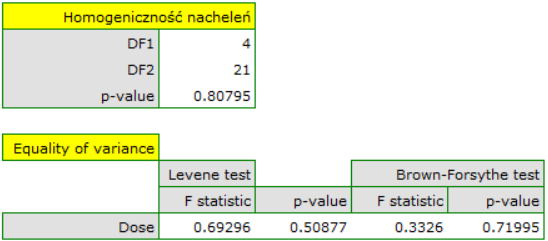
The assumptions of ANCOVA remained to be checked. Homogeneity of variance and the constancy of the regression line slopes were confirmed using tests:
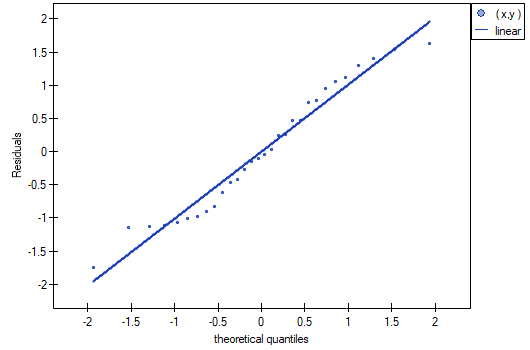
Normality of the distribution of the residuals was assessed visually by plotting Q-Q plots:
Example 2. (stress.pqs file)
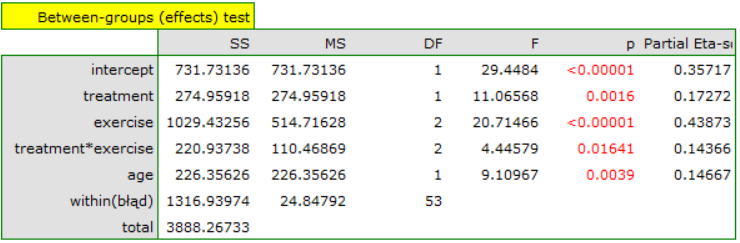
This example comes from the Datarium R-Cran package. Researchers want to assess the effect of a new treatment and of exercise on stress reduction, after accounting for differences in age. The stress measurement is the interval outcome variable \(Y\). Because the variables "treatment" and "exercise" have 2 and 3 categories respectively, we will carry out a two-way ANCOVA to determine whether the interaction between exercise and treatment, while simultaneously accounting for the subjects' age, is related to stress.
| Factors | |
| treatment \(X_1\) | exercise \(X_2\) |
| yes | low |
| moderate | |
| high | |
| no | low |
| moderate | |
| high | |
In the analysis window we set "stress" as the dependent variable, "treatment" and "exercise" as factors, and add the interaction of these two variables; the continuous covariate is "age".
We will plot the expected mean stress levels for each of the six subgroups into which the interaction has divided our data, and determine the post-hoc tests.
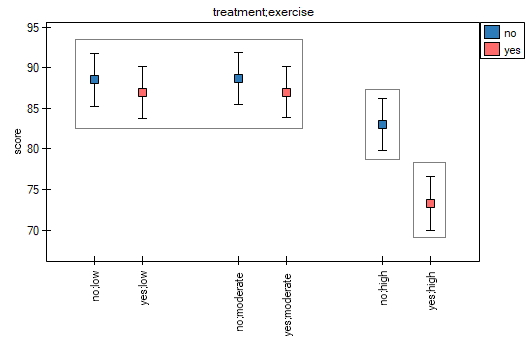
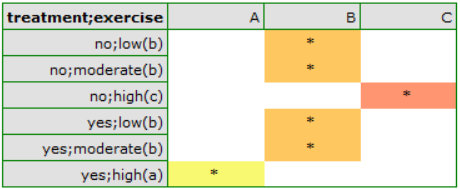
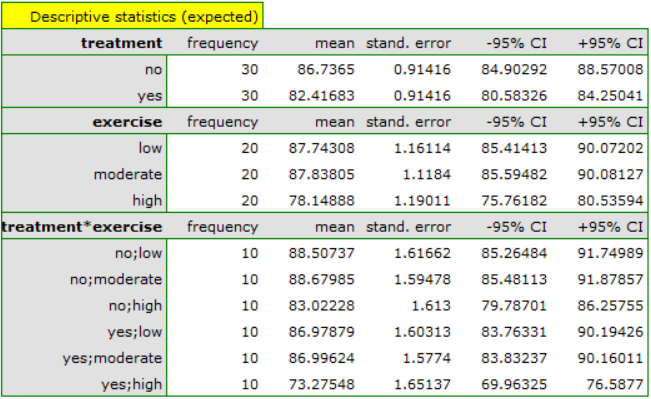
According to the results of the post-hoc test, we can speak of three distinct homogeneous groups: (B) the group with the highest stress level is the group that exercises little or moderately (regardless of whether they are treated or not); (C) the group with a lower stress level is the group that exercises a lot and is not treated; (A) the group with the lowest stress level is the group that exercises a lot and is treated. The values of the individual means, together with their confidence intervals, are shown in the table:
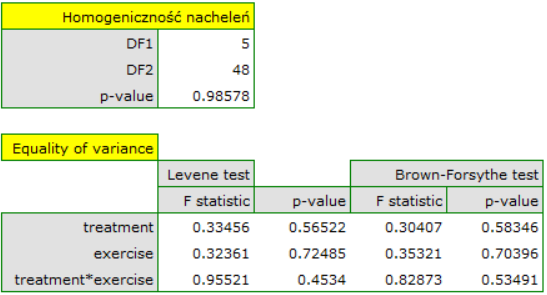
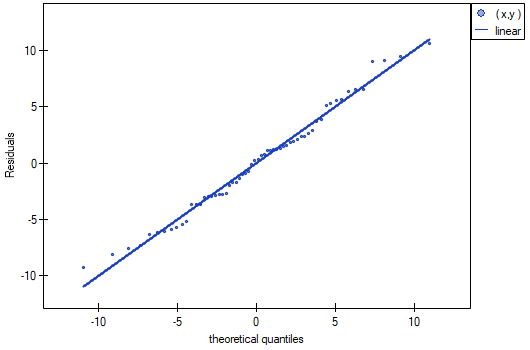
The assumptions of equality of variance, equality of the regression line slopes, and normality of the model residuals are met:
Hypotheses – for a single factor \(A\):
where \(\mu_1,\mu_2,...,\mu_a\) – the expected means of factor \(A\) for its individual categories (adjusted for the covariates).
Hypotheses – for the interaction of factors \(A*B\):
where \(\mu_1,\mu_2,...,\mu_{ab}\) – the expected means of the interaction of factors \(A*B\) for their individual categories (adjusted for the covariates).