 PQStat
The number of scientific papers appearing has grown very significantly over the last decade. This makes access to knowledge easier, but makes it harder to keep up with the constant flow of new information. For example, if a doctor were to apply a new treatment for their patients based on a single scientific paper they had read, they could make a mistake – other, equally credible papers may contradict the effectiveness of that treatment. For a doctor's decision to be as well justified as possible, they should know most of the scientific papers published on the topic, and constantly reviewing an ever-growing body of literature would take so much time that there would be none left for treating patients. Meta-analysis allows such a review to be done quickly, because it is a statistical summary of the results described in many independent papers on the same topic.
Meta-analysis in PQStat is performed based on the following measures (final effects):
- Difference of means,
- Cohen's d,
- Hedges' g,
- Ratio of means,
- Odds ratio (OR),
- Relative risk (RR),
- Risk difference (RD),
- Pearson coefficient,
- AUC for the ROC curve,
- Proportion.
Introduction to meta-analysis and data preparation
When to use:
Meta-analysis is used when we want to statistically summarize the results of many independent scientific papers concerning the same issue. The image most commonly associated with meta-analysis is the forest plot, showing the results of individual studies together with their combined summary.
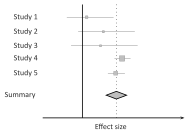
For the selected literature to be summarized jointly, it must be consistent in its description, and the measures reported in it must be equivalent.
Assumptions
For a given scientific paper to be usable in a meta-analysis, it should make it possible to determine:
- the final effect – i.e. the statistical measure indicating the result obtained in the paper. In practice this can be various kinds of quantities, e.g. difference of means, odds ratio, relative risk, etc.
- the effect error, i.e. SE (Standard Error) – describing the precision of the study performed. The smaller the error (SE), the greater the precision of a given study, and consequently the greater its weight and influence on the meta-analysis result.
- the sample size, i.e. the number of objects on which the study was performed – required in some situations.
Definitions of measures
The p-value (statistical significance) is not used directly in meta-analysis. The same effect size may be statistically significant in a large study and non-significant in a study based on a small sample – and vice versa: a small effect size may be statistically significant in a large study, and a large effect size may be non-significant in a small study. This results from the power of statistical tests. When testing statistical significance we only check whether an effect exists at all (whether it differs from zero), not whether it is large enough to translate into desired outcomes – e.g. the fact that a drug statistically significantly lowers blood pressure by 1 mmHg will not lead to it being used, since from a clinical point of view this is too small a value. Meta-analysis focuses primarily on the magnitude of individual effects, not on their statistical significance, so it does not matter much whether the papers used in the meta-analysis themselves indicate statistical significance of a given effect or not.
In PQStat, however, statistical significance is calculated for each study, determined from the ratio of the effect to its error. This is an asymptotic approach, based on the normal distribution, dedicated to large groups. If a different test was used in the cited study to check statistical significance, the results obtained may differ slightly.
How to set up the analysis
The data preparation window for meta-analysis is opened via the menu:
Advanced statistics\(\to\)Meta-analysis\(\to\)Data preparation.
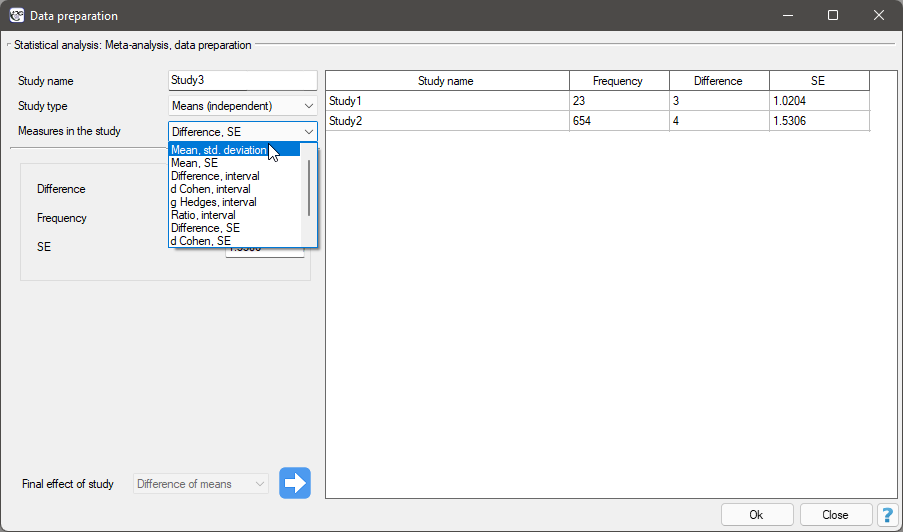
In the data preparation window for meta-analysis, the researcher first provides the name of the study being entered. This name should uniquely identify the study, since it will describe it throughout all meta-analysis results, including on charts. The desired Final effect of the study, its error and sample size are calculated based on the measures obtained from the relevant scientific paper. The measures contained in studies, on the basis of which final effects can be calculated, are presented in the table below:
| Study type | Measures in the study | Final effect |
| Independent means | Means, deviations | a, b, c, e |
| Means, SE | a, b, c, e | |
| Difference, interval | a | |
| Cohen's d, interval | b | |
| Hedges' g, interval | c | |
| Ratio, interval | e | |
| Difference, SE | a | |
| Cohen's d, SE | b | |
| Hedges' g, SE | c | |
| Ratio, SE | e | |
| Dependent means | Means, deviations | a, b, c |
| Means, SE | a, b, c | |
| Difference, interval | a | |
| Cohen's d, interval | b | |
| Hedges' g, interval | c | |
| Difference, deviation | a, b, c | |
| Difference, SE | a, b, c | |
| Cohen's d, SE | b | |
| Hedges' g, SE | c | |
| Mean vs. set value | Mean, deviation | a |
| Mean, SE | a | |
| Mean – summary | Mean, deviation | d |
| Mean, SE | d | |
| Tables | 2x2 table | b, c, f, g, h |
| OR, interval | b, c, f | |
| RR, interval | g | |
| RD, interval | h | |
| Cohen's d, interval | b, c, f | |
| Hedges' g, interval | b, c, f | |
| OR, SE | b, c, f | |
| RR, SE | g | |
| RD, SE | h | |
| Cohen's d, SE | b, c, f | |
| Hedges' g, SE | b, c, f | |
| Correlation | Coefficient | i |
| Coefficient, interval | i | |
| Coefficient, SE | i | |
| ROC curve | AUC, SE | j |
| AUC, interval | j | |
| One proportion | Given group size | k |
| Given proportion | k |
where the individual final effects are:
- a - Difference of means
- b - Cohen's d
- c - Hedges' g
- d - Mean
- e - Ratio of means
- f - Odds ratio (OR)
- g - Relative risk (RR)
- h - Risk difference (RD)
- i - Pearson coefficient
- j - AUC (ROC curve)
- k - Proportion
Performing and interpreting the analysis
Example 1. We are interested in the effect of cigarette smoking on the risk of disease X. We want to perform a meta-analysis whose final effect will be the relative risk (RR). Under this assumption, the papers selected for the meta-analysis must make it possible to calculate the RR and its error.
Step 1. Based on the description of the final effect (see the table above), it was established that the relative risk (described as result g) can be determined in PQStat in three situations, i.e. if a given scientific paper reports: the RR and its confidence interval, or the RR together with its error, or the appropriate sample sizes in four categories, i.e. a 2x2 table.
Step 2. 10 papers meeting the inclusion criteria and allowing the relative risk to be determined (see step 1) were selected for the meta-analysis. The data needed, contained in the selected papers, is:
Study 1: group sizes: (smokers and ill)=100, (smokers and not ill)=73, (non-smokers and ill)=80, (non-smokers and not ill)=70,
Study 2: group sizes: (smokers and ill)=182, (smokers and not ill)=172, (non-smokers and ill)=180, (non-smokers and not ill)=172,
Study 3: group sizes: (smokers and ill)=157, (smokers and not ill)=132, (non-smokers and ill)=125, (non-smokers and not ill)=201,
Study 4: group sizes: (smokers and ill)=19, (smokers and not ill)=15, (non-smokers and ill)=35, (non-smokers and not ill)=20,
Study 5: group size: 278, RR[95%CI]=1.03[0.85-1.25],
Study 6: group size: 560, RR[95%CI]=1.21[1.05-1.40],
Study 7: group size: 1207, RR[95%CI]=1.04[0.93-1.15],
Study 8: group size: 214, RR[95%CI]=1.15[0.95-1.40],
Study 9: group size: 285, RR[95%CI]=1.36[1.03-1.79],
Study 10: group size: 1968, RR=1.17, SE(lnRR)=0.0437,
Step 3. Using the study preparation window for meta-analysis, the data was entered into the data sheet. The first four studies are entered by selecting tables; studies five through nine are entered by selecting RR and interval; the last study provides all the necessary data, i.e. RR and SE. As the Final effect of the study we set Relative risk (RR):
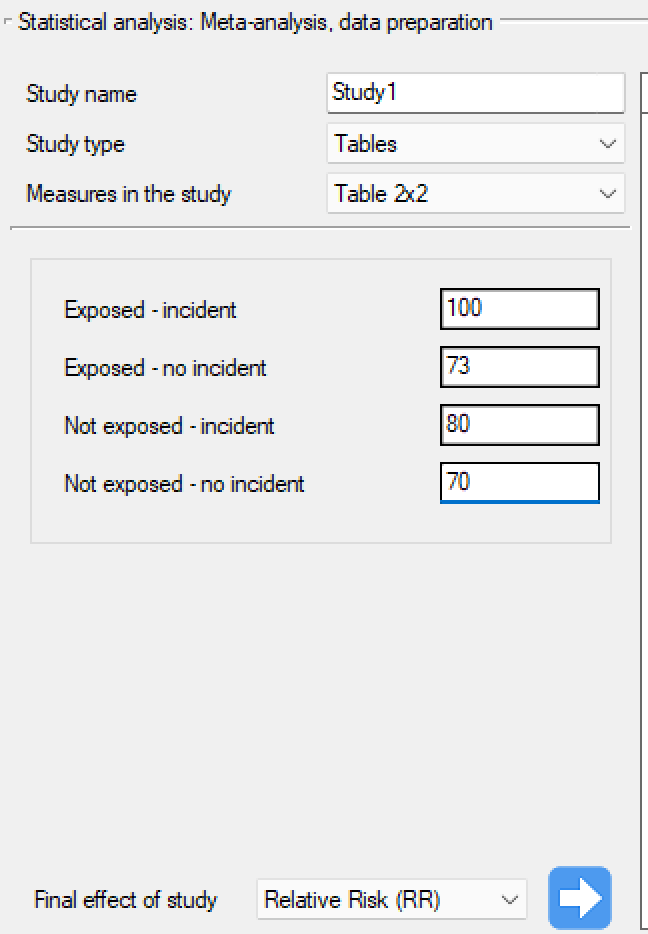
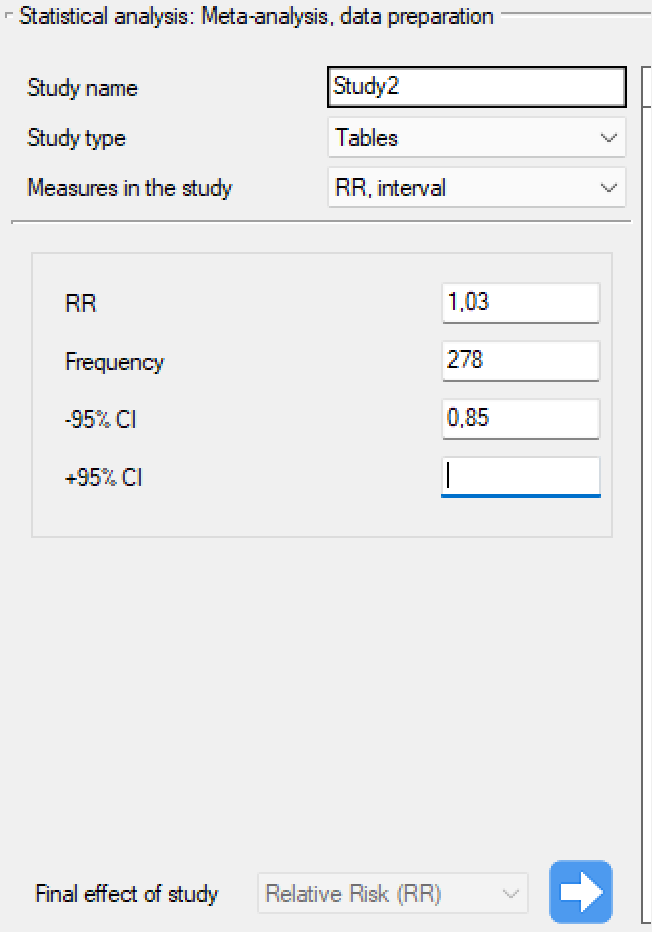
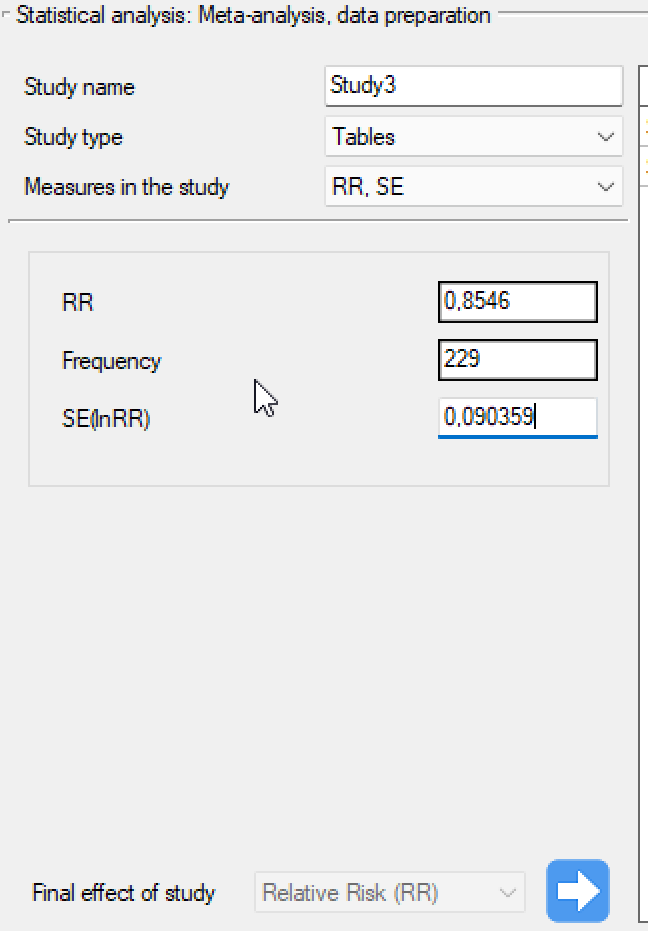
Each entered study is moved to the window on the right using  . Using the OK button, we transfer the prepared studies to the data sheet. Based on the information about individual studies contained in the data sheet, one can proceed to perform the meta-analysis.
Summary effect – fixed effect and random effect
When to use:
The most desirable element of a meta-analysis is a summary of the collected studies, i.e. determining a common effect \(M\). Such a summary can be performed in two ways – by determining a fixed effect or a random effect.
Definitions of measures
Fixed effect – when calculating the fixed effect, we assume that all studies in the meta-analysis share one common true effect. So if every study concerned the same population (e.g. the same country), then when summarizing the meta-analysis with a fixed effect we assume that the true (population) effect is the same in each of these studies, and consequently – that all factors that could disturb the size of this effect are also the same (e.g. the age or sex of the subjects is similar in every study). Differences in the effects obtained for individual studies then result only from sampling error (the internal error of each study), i.e. from the size of \(SE\).
The fixed effect estimates the population effect – the true effect common to every study. The confidence interval around the fixed effect (the width of the diamond on the forest plot) depends only on the individual \(SE\) values.
Random effect – when calculating the random effect, we assume that each study represents a slightly different population, so the true (population) effect is different for each of them. So if every study concerned a different country, then when summarizing the meta-analysis with a random effect we assume that some factors that could disturb the size of this effect (e.g. level of education or wealth) differ between countries, so the true effect (e.g. the mean increase in fertility) is also somewhat different in each of them. Differences in the effects obtained for individual studies then result from sampling error (the error within each study), i.e. from the size of \(SE\), and from differences between the studied populations, i.e. from the heterogeneity of the studies (\(T^2\)). This heterogeneity must not be too large – too great a diversity of the studied populations indicates that there are no grounds for a joint summary.
The random effect estimates the weighted mean of the true (population) effects of individual studies. The confidence interval around the random effect (the width of the diamond on the forest plot) depends on the individual \(SE\) values and on \(T^2\).
Confidence interval vs. prediction interval
95% confidence interval (the width of the diamond on the forest plot) – means that in 95% of cases of such meta-analyses, the summary random effect will fall within the interval determined by the diamond.
95% prediction interval – means that in 95% of cases the true (population) effect of a new study will fall within the determined interval.
Study weight and its contribution – the weight \(w_i\) of a study depends on the observed variability: for the fixed effect it results only from the sampling error (SE) of a given study, and for the random effect – additionally from differences between studies, i.e. from the observed variance \(T^2\) (the smaller the error, the greater the weight and the greater the influence of the study on the meta-analysis result). Based on the weights assigned to individual studies, the contribution of a given study to the whole analysis is determined, i.e. the percentage that the weight of a given study represents in relation to the total weight of all included studies.
How to set up the analysis
The window with the meta-analysis settings is opened via the menu:
Advanced statistics\(\to\)Meta-analysis\(\to\)Summary.
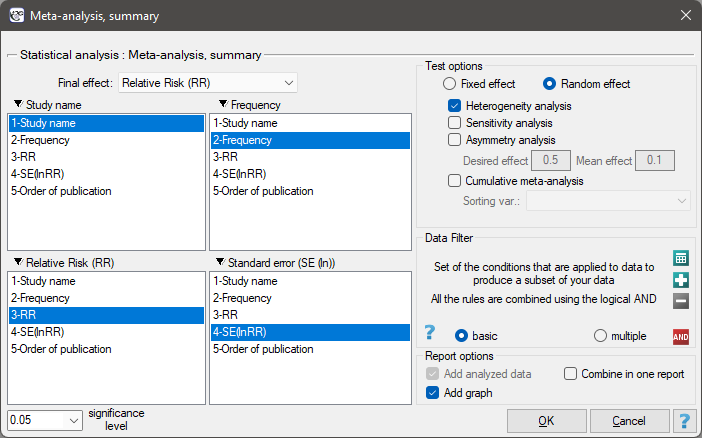
In this window, depending on the selected final effect, a meta-analysis summary can be performed, along with basic analyses allowing its assumptions to be checked, such as heterogeneity or publication bias (sensitivity testing, asymmetry testing), as well as a cumulative meta-analysis.
Performing and interpreting the analysis
Example 2. (file MetaanalizaRR.pqs)
The risk of disease X was studied for smokers and non-smokers. Some scientific papers indicated that the risk of disease X was higher for smokers, while others did not prove such a relationship. To establish whether cigarette smoking has an effect on the occurrence of disease X, a meta-analysis was planned. A thorough literature review was performed, and on this basis 10 scientific papers were selected that had data allowing the relative risk (i.e. the risk of illness for smokers relative to the risk of illness for non-smokers) and its error (the precision of a given study) to be calculated. The data was prepared for meta-analysis and saved in a file.
Because the papers included in the meta-analysis came from different centers and covered slightly different populations, the summary was performed by selecting the random effect. The relative risk was selected as the final effect, and the results were presented on a forest plot.
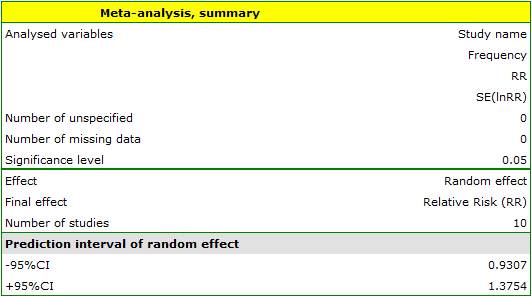
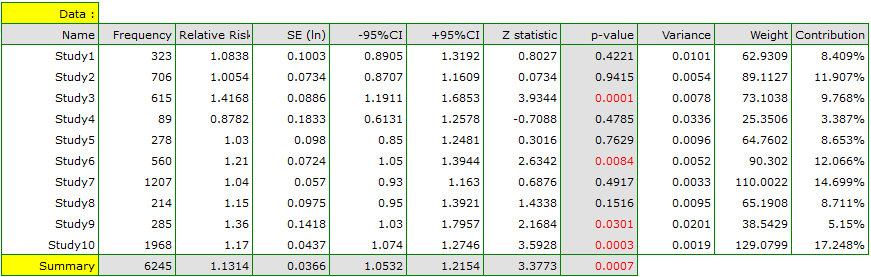
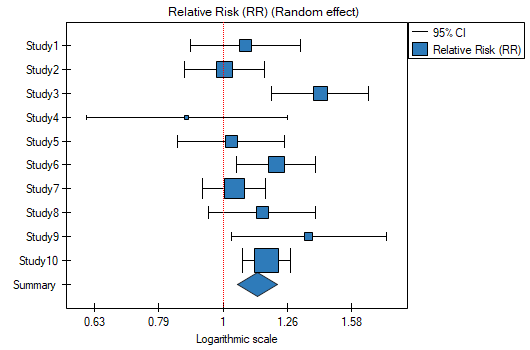
The results of four studies (studies 3, 6, 9 and 10) indicate a significantly higher risk of illness for smokers. The result summarizing the performed meta-analysis is also statistically significant and confirms the same effect.
Unfortunately, the prediction interval of the random effect is wider: [0.93-1.38], which means that in 95% of cases the true, population relative risk obtained in subsequent studies could be either greater or smaller than one.
Study weight
Formulas:
For the fixed effect, the variability results only from the sampling error (the error within each study), i.e. from the size of \(SE\):
For the random effect, the variability results from the sampling error (the error within each study), i.e. from the size of \(SE\), and from the differences between studies, i.e. from the observed variance \(T^2\):
Heterogeneity testing
When to use:
It is hard to expect every study to end up with exactly the same effect size – results obtained in different papers will naturally be somewhat different. Heterogeneity testing is intended to establish to what extent the differences appearing between the effects obtained in different papers affect the summary effect constructed in the meta-analysis. The summary effect summarizes the results obtained in individual papers well if the differences between the individual effects are natural, i.e. small. Large differences in the observed effects may indicate that the studies are not homogeneous, and that it is necessary to separate more homogeneous subgroups, e.g. dividing the collected papers into several subgroups with respect to an additional factor. For example: a given drug acts differently on younger people than on older people, so in papers based mainly on data from young people the obtained effect may differ considerably from papers conducted on older people. Dividing the collected papers into more homogeneous subgroups allows for a better estimation of the summary effect for each of these subgroups separately.
Heterogeneity testing checks whether the variability between studies is zero.
Definitions of measures
Additional measures describing heterogeneity are the \(I^2\) and \(H^2\) coefficients. The \(I^2\) coefficient determines the percentage of the observed variance that results from a true difference in the size of the studied effects (graphically, it reflects the degree of overlap of the confidence intervals of individual studies). Because it lies between 0% and 100%, it is easy to interpret and is widely used: if \(I^2=0\), the entire observed variance of the effect sizes is „false”, so if the confidence interval determined around the \(I^2\) coefficient contains the value 0, the obtained variance can be considered statistically non-significant. The closer the value of \(I^2\) is to 100%, the more one should consider abandoning a joint summary of the studies. It is assumed that \(I^2\approx 25\%\) indicates weak, \(I^2\approx 50\%\) moderate, and \(I^2\approx 75\%\) strong heterogeneity of the studies. The \(H^2\) coefficient, on the other hand, is considered relative to the value 1 – if the confidence interval for \(H^2\) contains the value 1, the obtained variance can be considered statistically non-significant, and the higher the value of \(H^2\), the greater the heterogeneity of the studies.
How to set up the analysis
The Heterogeneity testing option is available in the meta-analysis Summary window (see above).
Performing and interpreting the analysis
Example (2) cont. (file MetaanalizaRR.pqs)
When studying the effect of cigarette smoking on the occurrence of disease X, the heterogeneity assumption of the studies was checked. For this purpose, the Heterogeneity testing option was selected in the analysis window.

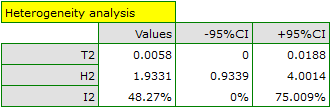
Only the confidence interval for the \(H^2\) coefficient considers the variability between studies to be non-significant (the interval for this coefficient is [0.93-4.00]). Bearing the above results in mind, it should be considered whether the collected papers can be summarized with one common final effect (a common relative risk), or whether it is worth determining a more homogeneous group of papers and performing the analysis again.
Hypotheses:
\(\begin{array}{cl} \mathcal{H}_0: & \tau^2 = 0,\\ \mathcal{H}_1: & \tau^2 \ne 0, \end{array}\)
where:
\(\tau^2\) – the variance of the true (population) effects of individual studies.
Formulas:
The test statistic is of the form:
where:
\(T^2\) – the variance of the observed effects,
\(W\) – a coefficient calculated based on the weights assigned to individual studies,
\(k\) – number of studies.
This statistic asymptotically (for large sample sizes) has a \(\chi^2\) distribution with degrees of freedom calculated by the formula \(df=k-1\).
The \(p\) value determined based on the test statistic is compared with the significance level \(\alpha\): when \(p \le \alpha\), we reject \(\mathcal{H}_0\) in favor of \(\mathcal{H}_1\); when \(p > \alpha\), there are no grounds to reject \(\mathcal{H}_0\).
Formulas (coefficients \(I^2\) and \(H^2\)):
The \(I^2\) and \(H^2\) coefficients are given by the formulas:
Sensitivity testing
When to use:
The summary effect of a study may change depending on which studies we include in the analysis and which we exclude from it. It is the researcher's responsibility to check how sensitive the analysis is to changes in the study selection criteria. Checking sensitivity allows the changes in the summary effect resulting from removing a given study to be established. The studies should be similar enough that removing one of them does not completely change the interpretation of the summary effect.
Definitions of measures
The value assigned to a given study called contribution of the remaining studies defines the percentage represented by the combined weight of the studies remaining in the analysis after a given study has been excluded. Precision change, on the other hand, indicates how the precision of the summary effect (the width of the confidence interval) will change when a given study is excluded from the analysis. A good illustration of a sensitivity analysis is a forest plot of the effect size and a plot of the precision changes when individual studies are excluded.
How to set up the analysis
The Sensitivity testing option is available in the meta-analysis Summary window (see above).
Performing and interpreting the analysis
Example (2) cont. (file MetaanalizaRR.pqs)
When studying the effect of cigarette smoking on the occurrence of disease X, the sensitivity of the analysis to excluding individual studies was checked. For this purpose, the Sensitivity testing option was selected in the analysis window, along with the forest plot (sensitivity) and bar plot (sensitivity).
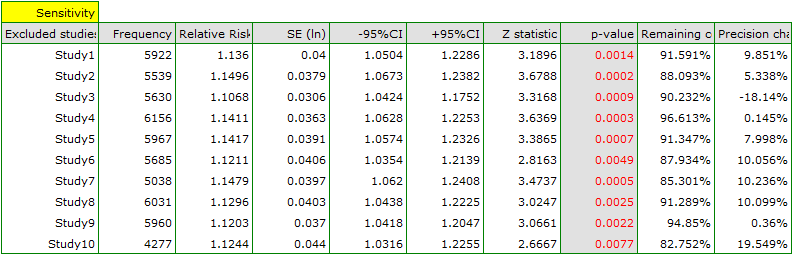
The results for the common relative risk, even when individual studies are not included, remain statistically significant.
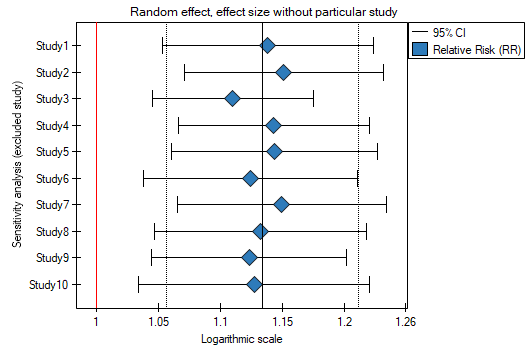
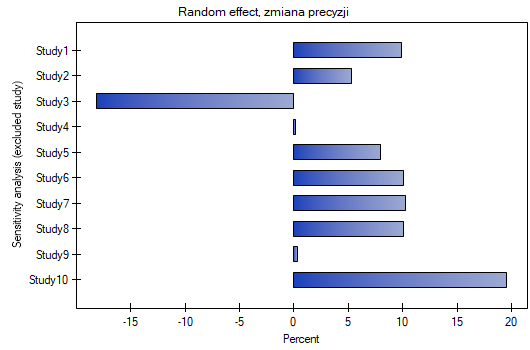
The analysis of the charts leads to the same conclusions – the narrowest interval and the most favorable change in precision are obtained after excluding Study 3.
Asymmetry testing (publication bias)
When to use:
Symmetry of the obtained effects usually indicates the absence of publication bias. However, it should be remembered that many objective factors can disturb symmetry – e.g. studies with statistically non-significant effects, or small studies, are often not published, which makes it much harder to find such results. At the same time, there are no sufficiently comprehensive and universal statistical tools for detecting asymmetry, and as a consequence a considerable proportion of meta-analyses are published despite a diagnosed asymmetry; such studies, however, require good justification for proceeding this way.
Definitions of measures
Funnel plot
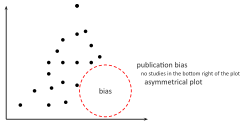
The standard way of checking for publication bias in the form of asymmetry is a funnel plot, showing the relationship between the size of a study (Y axis) and the size of the summary effect (X axis). It is assumed that large studies (placed in the upper part of the plot), in a properly selected set, are located close to each other and determine the center of the funnel, while smaller studies are located lower and are more varied and symmetrically distributed. Instead of the study size on the Y axis, the effect error of a given study can be shown, which is a better solution – the effect error is a measure that indicates the quality of the study and also carries information about its sample size.
Egger's test – since the interpretation of a funnel plot is always subjective, the Egger coefficient (Egger, 1997[55]) – the intercept of a fitted regression line – can be helpful. This coefficient is based on the correlation between the reciprocal of the standard error and the ratio of the effect size to its error. The further the value of the coefficient is from 0, the greater the asymmetry. The direction of the coefficient determines the type of asymmetry: a positive value together with a positive confidence interval indicates too large an effect size in small studies, and a negative value together with a negative confidence interval – too small an effect size in small studies.
Testing the „fail-safe” number – the number of papers that would be needed to undermine the obtained summary effect. Rosenthal's Nfs (Rosenthal, 1979[142]) determines the number of papers not indicating the presence of an effect (e.g. a mean difference of 0, an odds ratio of 1, etc.) that is needed to reduce the summary effect from statistically significant to non-significant. Rosenthal (1984[131]) defined the number of papers constituting the cutoff point as \(5k+10\). By determining the ratio of \(Nfs\) to the cutoff point, we obtain the coefficient(fs) – if it is greater than 1, the probability of publication bias is minimal. Orwin's Nfs (Orwin, 1983[131]), on the other hand, determines the number of papers with the average effect indicated by the researcher that is needed to reduce the summary effect to the desired size indicated by the researcher.
How to set up the analysis
The Asymmetry testing option is available in the meta-analysis Summary window (see above).
Performing and interpreting the analysis
Example (2) cont. (file MetaanalizaRR.pqs)
When studying the effect of cigarette smoking on the occurrence of disease X, the asymmetry assumption of the studies, i.e. publication bias, was checked. For this purpose, the Asymmetry testing option was selected in the analysis window, along with the funnel plot.
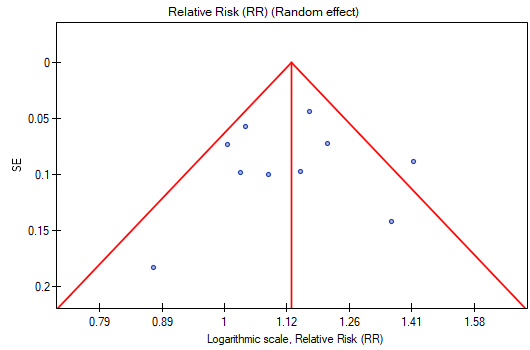
The points representing the individual studies are symmetrically distributed on the funnel plot. Admittedly, one study lies outside the triangle (Study 3), but it is close to its edges, so based on the plot too we have no fundamental objections regarding the selection of studies – the only doubt concerns the third study.
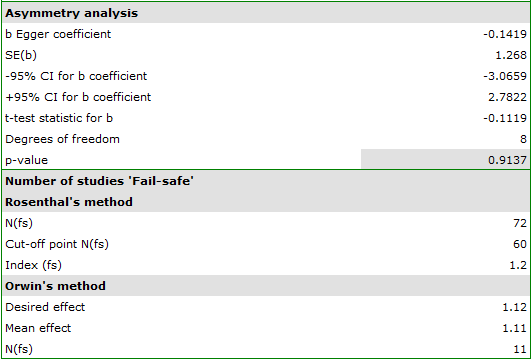
The „fail-safe” number of publications determined using Rosenthal's method is large, at 72. Therefore, for the summary effect (the relative risk common to all studies) to become statistically non-significant (i.e. for cigarette smoking to have no effect on the risk of disease X), 72 more papers, in which the relative risk equals one, would need to be added to the collected papers. The obtained effect can therefore be considered stable, since it will not be easy (with a small number of papers) to undermine the obtained effect.
The obtained common relative risk is RR=1.13. Using Orwin's method, it was checked how many papers with a relative risk of 1.11 would need to be included for the common relative risk to fall to 1.12. The result obtained was 11 papers. When reducing the relative risk from 1.11 to 1.10, however, only 5 papers are needed for the common relative risk to be 1.12.
Egger's test
Hypotheses:
\(\begin{array}{cl} \mathcal{H}_0: & b = 0,\\ \mathcal{H}_1: & b \ne 0, \end{array}\)
where:
\(b\) – the intercept in Egger's regression equation.
Formulas:
The test statistic is of the form:
where:
\(SE(b)\) – the standard error of the intercept.
The test statistic has a \(t\)-Student distribution with \(k-2\) degrees of freedom.
The \(p\) value determined based on the test statistic is compared with the significance level \(\alpha\): when \(p \le \alpha\), we reject \(\mathcal{H}_0\) in favor of \(\mathcal{H}_1\); when \(p > \alpha\), there are no grounds to reject \(\mathcal{H}_0\).
Rosenthal's Nfs
where:
\(Z_i\) – the value of the test statistic (with normal distribution) for a given study,
\(Z_c\) – the critical value of the normal distribution for the given significance level,
\(k\) – number of studies in the meta-analysis.
Orwin's Nfs
where:
\(M\) – the summary effect obtained in the meta-analysis,
\(M_d\) – the desired effect size indicated by the researcher,
\(\overline{M_{fs}}\) – the average effect of the papers added to the analysis, indicated by the researcher.
Cumulative meta-analysis
When to use:
The typical purpose of performing a cumulative meta-analysis is to show how the effect has changed since the last meta-analysis on a given topic was performed/published, or how it has changed over recent years. In that case, subsequent studies are added chronologically (according to the timeline), and each time a summary effect is calculated. Equally important is a cumulative analysis examining the change of the summary effect depending on the magnitude of the influence of a selected additional factor – then the studies are sorted according to the magnitude of this factor, and for successively added studies a common summary effect is calculated.
Definitions of measures
Depending on the purpose of the cumulation, a variable according to which individual studies will be sorted should be chosen, i.e. the order in which studies are added to the meta-analysis summary should be established – this can be any numeric variable. The value assigned to a given study called cumulative contribution defines the percentage represented by the combined weight of the studies included in the analysis, i.e. the given study and the studies preceding it. Precision change, on the other hand, indicates how the precision of the summary effect (the width of the confidence interval) will change when a given study is added to the studies preceding it. A good illustration of a cumulative analysis is a forest plot of the effect size and a plot of the precision changes as individual studies are added.
How to set up the analysis
The Cumulative meta-analysis option is available in the meta-analysis Summary window (see above).
Performing and interpreting the analysis
Example (2) cont. (file MetaanalizaRR.pqs)
When studying the effect of cigarette smoking on the occurrence of disease X, it was checked how the obtained results evolved over time. For this purpose, the Cumulative meta-analysis option was selected in the analysis window, along with the variable according to which successive papers would be included in the meta-analysis, and the forest plot (cumulative) and bar plot (cumulative) were selected.
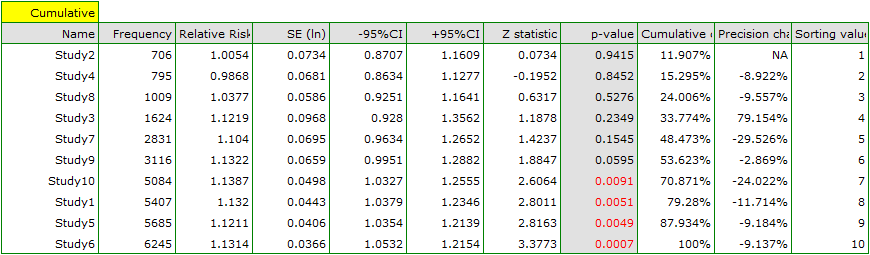
As new papers appeared, the obtained summary effect gained in strength, and its significance was achieved after Study 10 was added to the earlier papers, and then also with subsequent studies.
In general, adding subsequent papers increased the precision of the obtained relative risk, with the exception of the situation in which Study 3 was added. This effect can be seen in the table and in the accompanying charts.
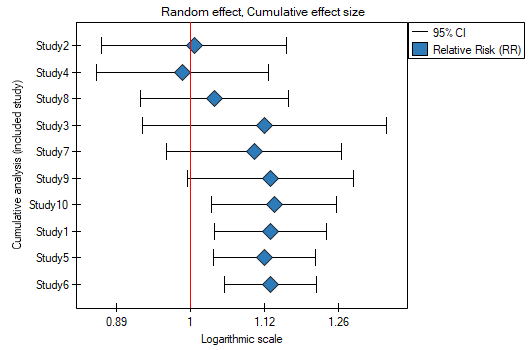
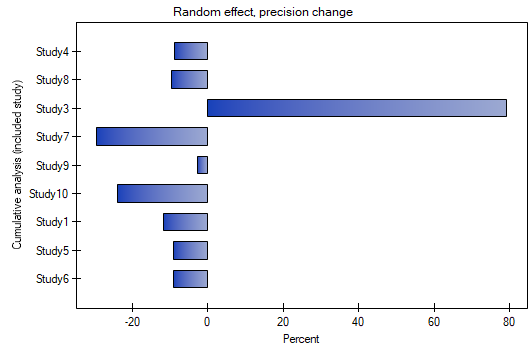
As a result, one should consider excluding Study 3 from the meta-analysis performed.
Group comparison
When to use:
There are situations in which the collected data concern the same effect, obtained on the same population, but under somewhat different conditions – e.g. some studies were performed under condition A, and some under condition B. It may then be interesting to compare the summary effects obtained for each group. Demonstrating differences between the summary effects can be the main goal of a meta-analysis – in that case it is not advisable to summarize both subgroups with a single common effect. If, however, the researcher is aware that the studies were performed under different conditions, but a joint summary of all the studies still seems purposeful, then after demonstrating the absence of statistically (or clinically) significant differences, they can perform a joint summary that takes into account the division into subgroups A and B, i.e. determine a common summary corrected for the different experimental conditions.
For example: country A has a somewhat different climate than country B. Having a series of studies concerning both countries and examining the vegetation of these countries, we can check whether climatic conditions affect the obtained study effects. A comparative analysis of the subgroups determined in this way will allow us to assess whether climate has a fundamental influence on the obtained results, and whether the results of the studies covering both countries can be summarized with one common effect, or whether separate summaries should be determined for each country. Another example could be dividing studies into those with full randomization and those without it, to check whether the studies without randomization give effects close enough to the studies with randomization to be included in a further, joint analysis.
Definitions of measures
A comparison of groups can be performed by choosing as the summary effect: the fixed effect, the random effect (separate \(T^2\)), or the random effect (pooled \(T^2\)), where \(T^2\) is the variance of the observed effects.
- Fixed effect is chosen when we assume that the studies within each group share one common true (i.e. population) effect.
- Random effect (separate \(T^2\)) is chosen when we assume that the studies within each group represent slightly different populations, and that the groups differ in the variance between studies.
- Random effect (pooled \(T^2\)) is chosen when we assume that the studies within each group represent slightly different populations, but the variance between studies is the same regardless of the group to which they belong.
As a result, each group is described separately with the chosen summary effect. The main goal is to compare the groups, i.e. to establish whether the compared groups differ in their true (population) summary effect – in practice this means checking whether the variance of the groups' summary effects is zero, i.e. testing the heterogeneity of the groups. The description and interpretation of the results of this analysis correspond to the chapter Heterogeneity testing, except that in the case of group comparison the heterogeneity concerns the summary effects of the compared groups, not individual studies, and the result depends on the chosen summary effect. If the result is statistically significant (the Q statistic, the \(I^2\) coefficient, or the \(H^2\) coefficient), this is a strong suggestion to abandon a joint summary of the compared groups.
Additional options for group comparison analysis:
- Heterogeneity testing within groups
The ability to analyze each group separately for heterogeneity (as described in the chapter Heterogeneity testing). The results obtained, in particular the determined variance \(T^2\), make it easier to choose between the random effect (separate \(T^2\)) and the random effect (pooled \(T^2\)) for the group comparison.
- Joint summary of the groups
If the differences obtained between the summary effects of the individual groups are small and non-significant, a joint summary of these groups, corrected for the division into the indicated groups, can be performed. The result of the joint summary depends on the observed differences (variability between studies and between groups), i.e. on the choice of summary effect. A good illustration of a joint summary of groups is a forest plot showing the results of individual studies together with the summary of each group and the joint summary of the groups.
- ANOVA comparison
An additional option for comparing groups, based on a different mathematical model than the comparison by testing the heterogeneity of groups, although both methods give converging results. The observed variance is broken down into between-group variance and within-group variance, and the latter – into the variance of each group separately.
How to set up the analysis
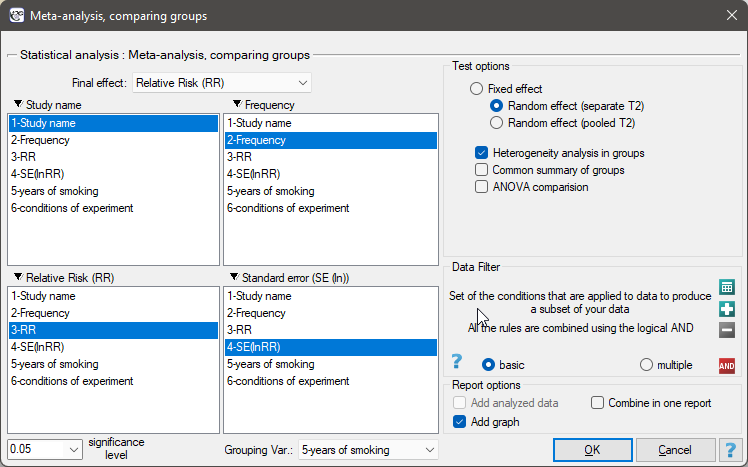
The window with the group comparison settings for meta-analysis is opened via the menu:
Advanced statistics\(\to\)Meta-analysis\(\to\)Group comparison.
Performing and interpreting the analysis
Example 3. (file MetaanalizaRR.pqs)
The risk of disease X was studied for smokers and non-smokers. To establish whether the length of time spent smoking has an effect on the occurrence of disease X, a meta-analysis was planned. A thorough literature review was performed, and on this basis 17 scientific papers were selected with a description of the relative risk and its error (the precision of a given study). Because the studies concerned different smoking durations, 3 groups of studies were distinguished:
- (1) studies concerning people smoking for more than 10 years,
- (2) studies concerning people smoking for 5 to 10 years,
- (3) studies concerning people smoking for less than 5 years.
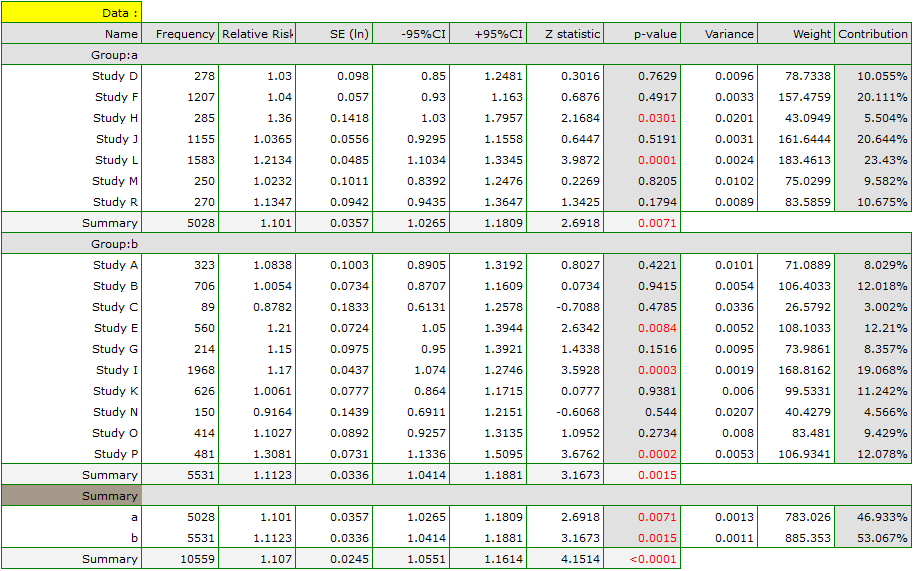
In addition, a division was made into two different conditions under which the studies were performed (different inclusion/exclusion criteria for subjects). The data was prepared for meta-analysis and saved in a file. The goal of performing the meta-analysis was to compare the age groups. In addition, it was checked whether the different experimental conditions translated into differences in the obtained relative risk.
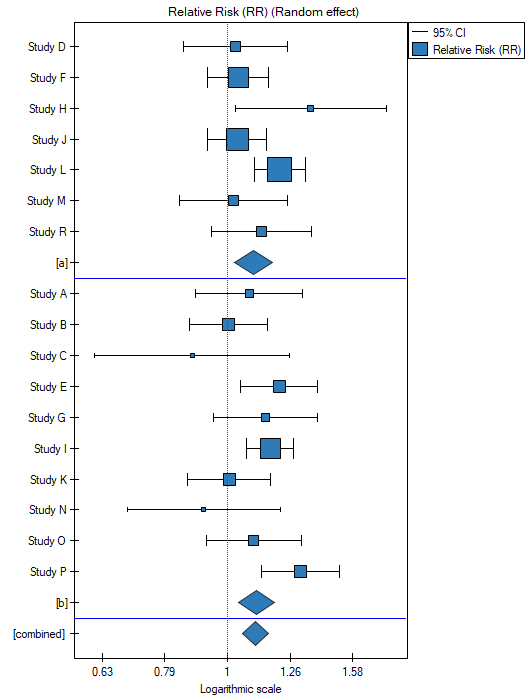
Because the papers included in the meta-analysis came from different centers and covered slightly different populations, the summary was performed by selecting the random effect (separate T2). The relative risk was selected as the final effect, and the results were presented on a forest plot.
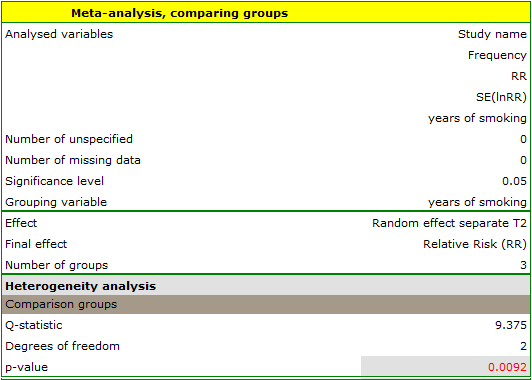
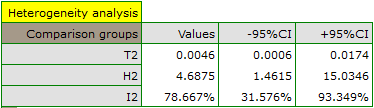
Therefore, the collected papers will not be summarized with a common effect, but only through a separate summary of each group.
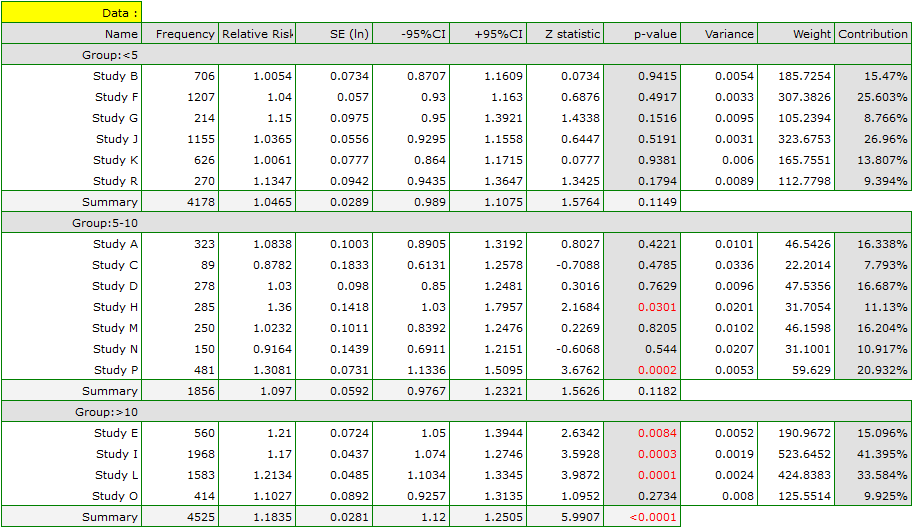
The forest plot likewise presents the summary of each group and does not contain a joint summary of the groups.
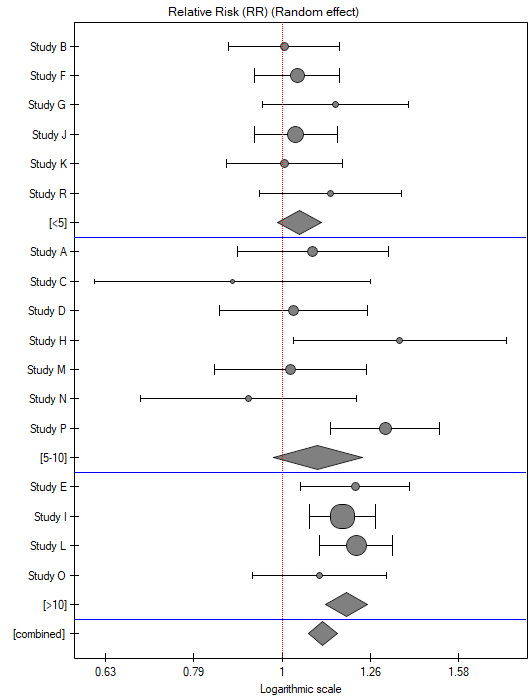
Additionally, the homogeneity within each group was checked, to make sure that they could be summarized separately.
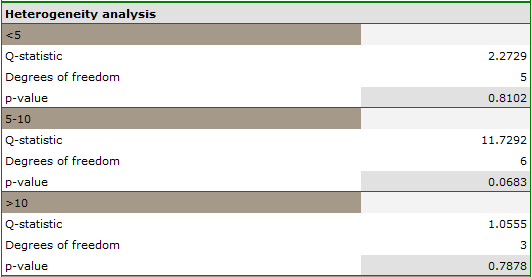
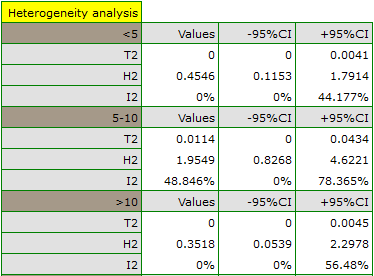
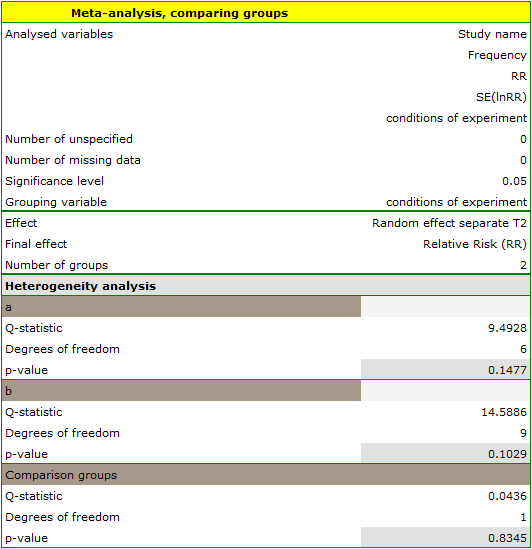
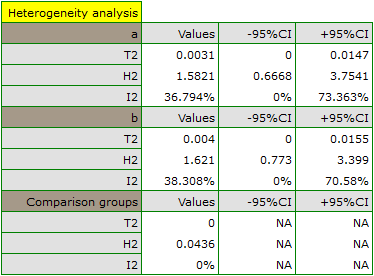
The results of the comparison concerning the different study conditions, on the other hand, indicate that these conditions have no significant effect on the summary effect. In this case, it is possible to calculate a common final effect corrected for the different study conditions, i.e. a joint summary of both groups.
Hypotheses for testing group heterogeneity:
\(\begin{array}{cl} \mathcal{H}_0: & \tau^2 = 0,\\ \mathcal{H}_1: & \tau^2 \ne 0, \end{array}\)
where:
\(\tau^2\) – the variance of the true (population) summary effects of the compared groups.
The \(p\) value determined based on the test statistic is compared with the significance level \(\alpha\): when \(p \le \alpha\), we reject \(\mathcal{H}_0\) in favor of \(\mathcal{H}_1\); when \(p > \alpha\), there are no grounds to reject \(\mathcal{H}_0\).
ANOVA comparison
Procedure:
Using the ANOVA approach, the total observed variance is broken down into between-group variance and within-group variance, and the latter into the variance of each group separately. As a result, the following \(Q\) statistics are determined:
- \(Q\) statistic (group 1) – examines the portion of the total variance relating to the first group, i.e. the variance between studies within the first group,
- \(Q\) statistic (group 2) – similarly for the second group,
- …
- \(Q\) statistic (group g) – similarly for the last group,
- \(Q\) statistic (within groups) \(=\) \(Q\) (group 1) \(+\) \(Q\) (group 2) \(+ \ldots +\) \(Q\) (group g) – examines the portion of the total variance relating to the inside of the individual groups,
- \(Q\) statistic (between groups) – examines the portion of the total variance relating to the differences between groups (a result identical to the group heterogeneity test),
- \(Q\) statistic (total) – examines the variance between all studies.
Each of the above \(Q\) statistics has a \(\chi^2\) distribution with the appropriate number of degrees of freedom.
Meta-regression
When to use:
Meta-regression is performed in a manner analogous to the regression analysis described in the chapter Multiple linear regression. In the case of meta-regression, the studied objects are the individual studies: their results (e.g. odds ratios, relative risks, mean differences) constitute the dependent variable \(Y\), i.e. the explained variable, while the additional conditions under which these studies were conducted constitute the independent variables (\(X_1\), \(X_2\), \(\ldots\), \(X_k\)), i.e. the explanatory variables. Just as in traditional regression models, the independent variables can interact, and those described on a nominal scale can be subject to special coding (more information in the chapter Preparing variables for analysis in multivariate models).
Meta-regression can be performed by choosing the fixed effect or the random effect.
- Fixed effect is chosen when we assume that the studies represent one common true effect, such that all factors that could disturb its magnitude are the same – except for the factors examined as independent variables in the model. This is a rare situation in practice, since it requires fully controlled conditions (difficult to satisfy when the studies are conducted by different centers and different researchers). It would be justified, for example, if all studies were performed by one center, on the same population, with only those conditions described by the examined characteristic being changed.
- Random effect is chosen when we assume that the studies may represent somewhat different populations, i.e. not all factors that could disturb the magnitude of the studied effect are described in every paper (they can be assumed to be similar, but do not have to be identical). The use of the random effect is more common, since individual studies are usually conducted by different centers under somewhat different conditions.
Assumptions
- the number of independent variables should be small – smaller than the number of papers on which the study is based (\(n\ge k+1\)).
Definitions of measures
Statistical significance of individual variables in the model – based on the coefficient and its error, we infer whether the independent variable for which this coefficient was estimated has a significant effect on the final effect.
Quality of the constructed meta-regression model is assessed with several measures:
- Coefficient \(R^2\) – a measure of model fit, expressing the percentage of variability between study effects explained by the model. The value of this coefficient lies in the range \(<0; 1>\), where 1 means a perfect fit of the model, and 0 – a complete lack of fit.
- Coefficient \(I^2\) – determines the percentage of the observed variance that results from a true difference in the size of the studied effects (cf. Heterogeneity testing).
Statistical significance of all variables in the model is checked using the ANOVA approach, determining the \(Q\)(model) statistic – the observed variance between studies is then broken down into the variance explained by the model and the residual variance (not explained by the model).
How to set up the analysis
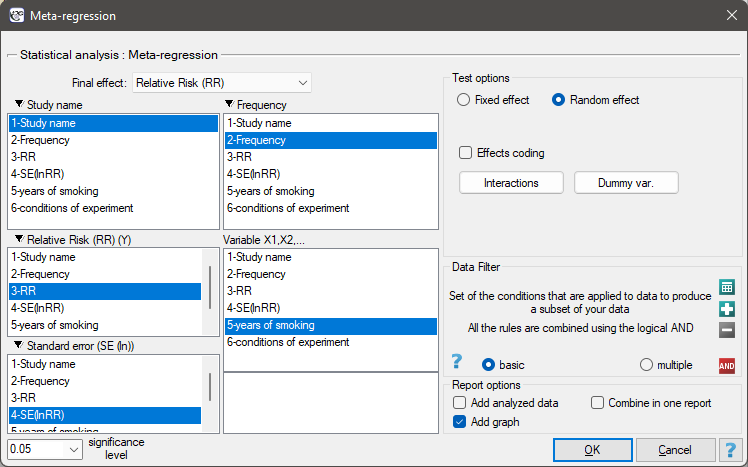
The window with the meta-regression settings is opened via the menu:
Advanced statistics\(\to\)Meta-analysis\(\to\)Meta-regression.
Performing and interpreting the analysis
Example (3) cont. (file MetaanalizaRR.pqs)
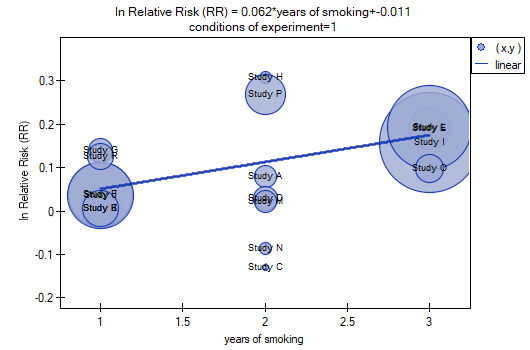
The risk of disease X was studied for smokers and non-smokers. To establish whether the length of time spent smoking has an effect on the occurrence of disease X, and whether the different experimental conditions translated into differences in the obtained relative risk, a meta-analysis comparing the identified groups of studies was performed. Based on the comparison of study groups, it was established that the last group (those smoking the longest, i.e. more than 10 years) shows a relationship between smoking and the occurrence of disease X, while for the groups with a shorter smoking duration no significant effect could be obtained. It was noted, however, that the effect systematically increases with the number of years of smoking. To test the hypothesis of a significant increase in the risk of disease X with increasing years of smoking, two regression models were built: in the first, the grouping variable Years of smoking was treated as a continuous variable, and in the second as a categorical (dummy) variable with a reference group of people smoking for less than 5 years. The data was prepared for meta-analysis and saved in a file.
Because the papers included in the meta-analysis came from different centers and covered slightly different populations, the meta-regression was performed by selecting the random effect. The relative risk was selected as the final effect, and the results were presented on a chart.


Because part of the studies was conducted according to other criteria (under different conditions), the results obtained for both models were corrected for the different study conditions.

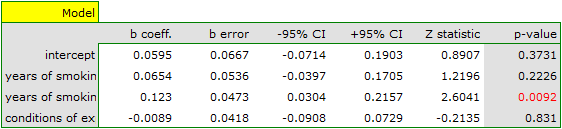
The correction performed did not change the underlying trend, so it can be concluded that the risk of disease X increases with the number of years of smoking, regardless of the methodology adopted (inclusion/exclusion criteria for subjects). The relationship obtained for the first model, assuming that the studies were conducted under condition „a” (indicated as the first condition), is shown in the chart.
Statistical significance of an individual coefficient
Hypotheses:
\(\begin{array}{cc} \mathcal{H}_0: & \beta_i=0,\\ \mathcal{H}_1: & \beta_i\ne 0. \end{array}\)
Formulas:
The test statistic is of the form:
The test statistic has a normal distribution.
The \(p\) value determined based on the test statistic is compared with the significance level \(\alpha\): when \(p \le \alpha\), we reject \(\mathcal{H}_0\) in favor of \(\mathcal{H}_1\); when \(p > \alpha\), there are no grounds to reject \(\mathcal{H}_0\).
Coefficient \(R^2\)
where:
\(T^2_{(model)}\) – the between-study variance explained by the model,
\(T^2_{(total)}\) – the total between-study variance.
Statistical significance of all variables in the model
Hypotheses:
\(\begin{array}{cc} \mathcal{H}_0: & \textrm{all } \beta_i=0,\\ \mathcal{H}_1: & \textrm{there exists }\beta_i\neq0. \end{array}\)
Procedure:
Using the ANOVA approach, the observed variance between studies is broken down into the variance explained by the model and the residual variance (not explained by the model). As a result, the following \(Q\) statistics are determined:
- \(Q\) statistic (residuals) – examines the portion of the total variance that is not explained by the model,
- \(Q\) statistic (model) – examines the portion of the total variance that is explained by the model,
- \(Q\) statistic (total) – examines the variance between all studies.
Each of the above \(Q\) statistics has a \(\chi^2\) distribution with the appropriate number of degrees of freedom.
The \(p\) value determined based on the test statistic is compared with the significance level \(\alpha\): when \(p \le \alpha\), we reject \(\mathcal{H}_0\) in favor of \(\mathcal{H}_1\); when \(p > \alpha\), there are no grounds to reject \(\mathcal{H}_0\).