 PQStat
TEST SUMMARIES
Instead of running successive tests one at a time, the program lets you run a whole set of several analyses at once, matched to the kind of groups being compared. Quantitative data will also be described with means, medians, etc., and qualitative data with counts and percentages.
How to run a summary
The Test summaries options window is opened via the menu Statistics\(\to\)Summaries\(\to\)Test summaries, after which you select the appropriate group of analyses.
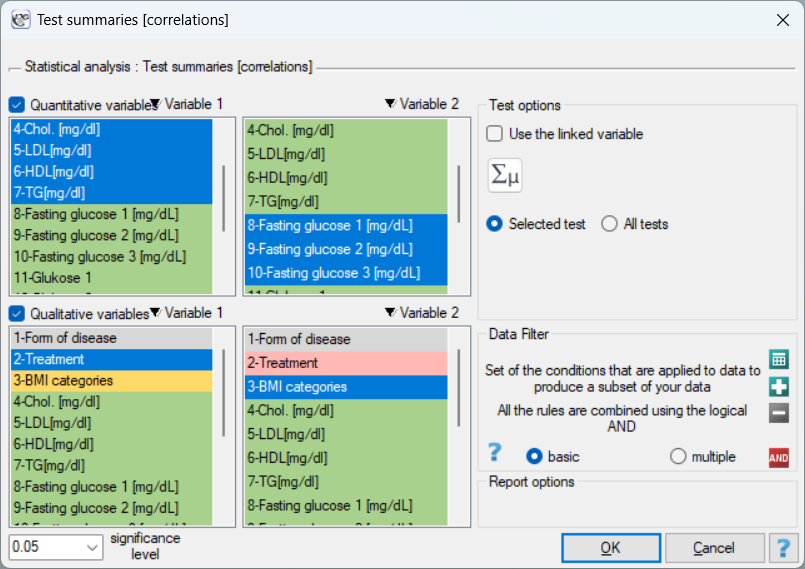
There are four groups of summaries to choose from:
Comparison of two dependent groups:
- The Student's t-test for dependent groups
- The Wilcoxon matched-pairs test
- The Bowker-McNemar test
- Normality of distribution test Kolmogorov-Smirnov (or another one selected by the user)
- and others ...
Comparison of two independent groups:
- The Student's t-test for independent groups
- The Mann-Whitney U test
- Chi-square, Fisher, OR/RR
- Normality of distribution test Kolmogorov-Smirnov (or another one selected by the user)
- and others ...
Comparison of multiple independent groups (see the description below):
- ANOVA for independent groups and Welch's ANOVA
- The Kruskal-Wallis ANOVA
- Chi-square and Fisher's test for large tables
- Levene's test of equality of variances, normality of distribution test (as above)
- post-hoc tests (Tukey HSD, Tamhane T2, Dunn, pairwise table comparisons) and homogeneous groups
- and others ...
Correlation:
- Pearson's linear correlation
- Spearman's monotonic correlation
- Chi-square, Fisher, correlation coefficient
- Normality of distribution test Kolmogorov-Smirnov (or another one selected by the user)
- and others ...
What the program returns
For each analyzed variable, depending on whether it is quantitative or qualitative, the program can return the following results in the report:
- the selected test - chosen automatically according to the rule described below;
- all tests together with their accompanying coefficients and measures, regardless of whether the minimum conditions for their use are met.
How the program selects the test automatically
- If, before the analysis, the user does not describe the individual variables with the appropriate scales, quantitative data are treated as an interval scale, and qualitative data as a nominal scale.
Testing for normality of distribution is based on the result of the normality test selected by the user when setting up the descriptive statistics.
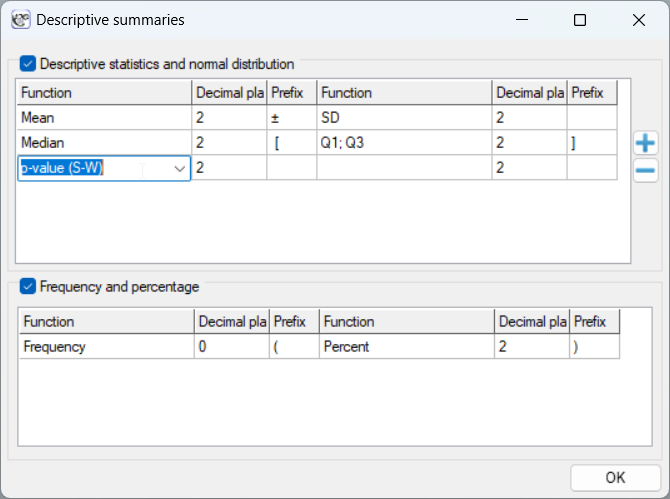
- If the user does not indicate any test for assessing normality of distribution in the descriptive-statistics window, normality will be checked using the Kolmogorov-Smirnov test.
Running the analysis and interpreting the results
Example 1. (Summaries.pqs file)
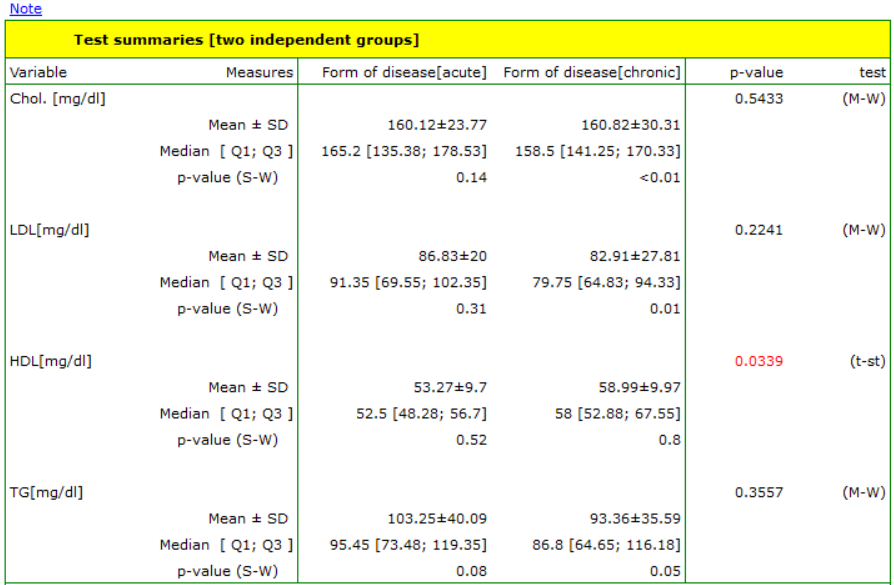
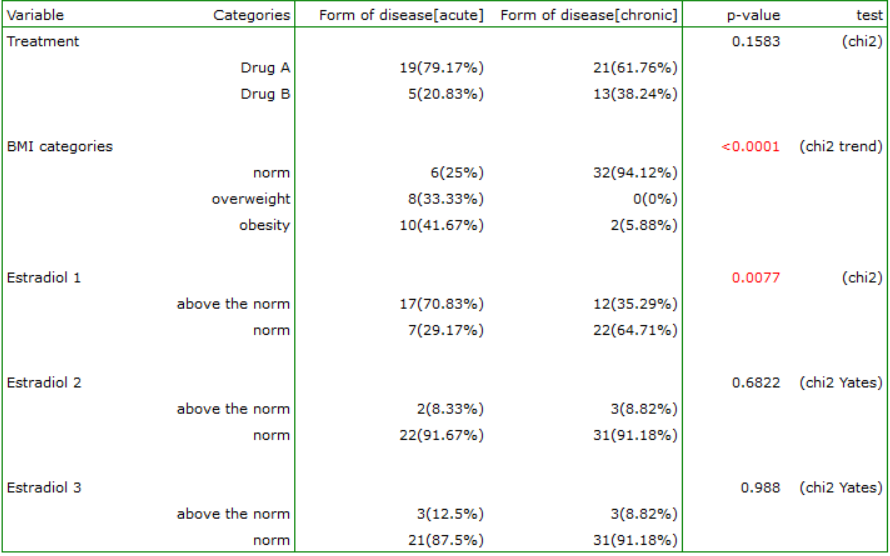
We want to make an automatic comparison of two independent groups: patients with a chronic condition versus patients with an acute form of the disease. The comparison is based on data described on the interval scale: Chol Tot., LDL, HDL, TG, on the ordinal feature BMI, and on nominal data: Treatment, Estradiol 1, Estradiol 2, Estradiol 3. To do this, we select the menu Summaries \(\to\) Test summaries [two independent groups] and select the grouping variable: Treatment, then select the interval data (in the section for quantitative variables) and the nominal and ordinal data (in the section for qualitative variables). We select the Selected test option and run the analysis.
"Quantitative variables:
For the interval scale with normality of distribution, the Student's t-test (t-st) was used, or its Cochran-Cox correction (C-C) when the group variances differed. For the interval scale, when the normality-of-distribution condition was not met, as well as for the ordinal scale, the Mann-Whitney test (M-W) was used. Normality of the data was tested with the Shapiro-Wilk test, and equality of variances with the Fisher-Snedecor test (F-S). If no scale was assigned to the analyzed variables, the data were assumed to come from an interval scale.
Qualitative variables:
For the nominal scale, the chi-square test (chi2) was used, and when Cochran's condition was not met, the Fisher exact test (Fisher exact) or, for 2x2 tables with a sample size greater than 40, the Yates correction (chi2-Yates). For the ordinal scale, the chi-square test for trend was used. If no scale was assigned to the analyzed variables, the data were assumed to come from a nominal scale."
Summary for multiple independent groups
The summary Statistics\(\to\)Summaries\(\to\)Test summaries [multiple independent groups] compares at the same time two or more groups defined by a grouping variable (e.g. several centres, several treatment schemes, age categories). For two groups it gives results consistent with the summary for two independent groups, but with tests intended for multiple groups (ANOVA instead of the Student's t-test, etc.), so with exactly two groups it is more convenient to use the two-group summary.
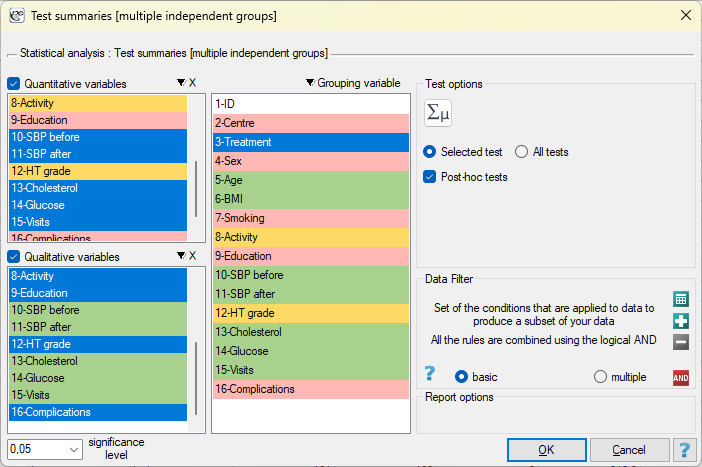
In the summary window we indicate the grouping variable and – as in the other summaries – the quantitative and qualitative variables, and then choose:
- Selected test or All tests – in the latter case, for quantitative variables the report contains columns with the result of the normality test in the groups, the Levene and Brown-Forsythe tests, ANOVA, Welch's ANOVA, Brown-Forsythe \(F^*\) ANOVA, the Kruskal-Wallis ANOVA, the Conover test of equality of rank variances and the effect-size measures \(\eta^2\) and \(\epsilon^2\); for qualitative variables – the results of the chi-square and Fisher exact tests for \(r\times c\) tables and, for the ordinal scale, the Kruskal-Wallis ANOVA for category codes;
- Post-hoc tests – when this option is checked, for variables whose main test turned out significant and there are at least three groups, multiple comparisons are performed: the Tukey HSD test after ANOVA, the Tamhane T2 test after Welch's ANOVA, the Dunn test with the Benjamini-Hochberg correction after the Kruskal-Wallis ANOVA, and for qualitative variables pairwise group comparisons with the chi-square or Fisher exact test with the Benjamini-Hochberg correction. In the post-hoc column the report lists the pairs of groups that differ significantly, and in the homogeneous groups (HG) columns the groups that do not differ significantly share a common letter.
The descriptive measures for each group by default also include the size \(N\); as in the other summaries, their scope is set in the descriptive statistics window.
Example 2. (summaries_groups.pqs file)
The file contains data of 1000 hypertensive patients treated in four centres with three schemes: Standard, New drug and Placebo. We want to check whether the treatment schemes differ in patient characteristics and treatment outcomes. The comparison is based on quantitative data: Age, BMI, SBP before, SBP after (systolic pressure before and after treatment), Cholesterol, Glucose and Visits (number of visits), on the ordinal features Activity and HT grade, and on nominal data: Sex, Smoking and Complications. The scales of the ordinal and nominal variables are already set in the file.
To do this, we select the menu Statistics\(\to\)Summaries\(\to\)Test summaries [multiple independent groups], indicate Treatment as the grouping variable, select the listed interval variables in the section for quantitative variables and the ordinal and nominal variables in the section for qualitative variables. We check the Selected test and Post-hoc tests options and run the analysis.
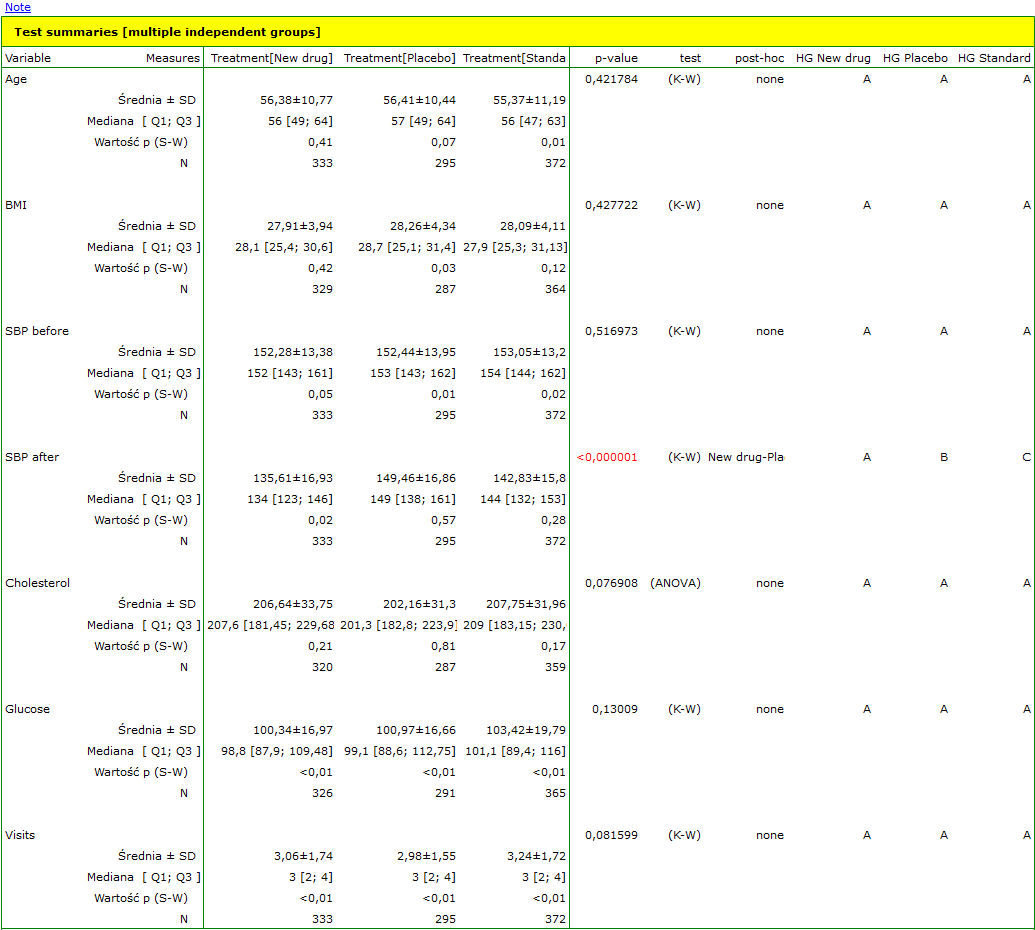
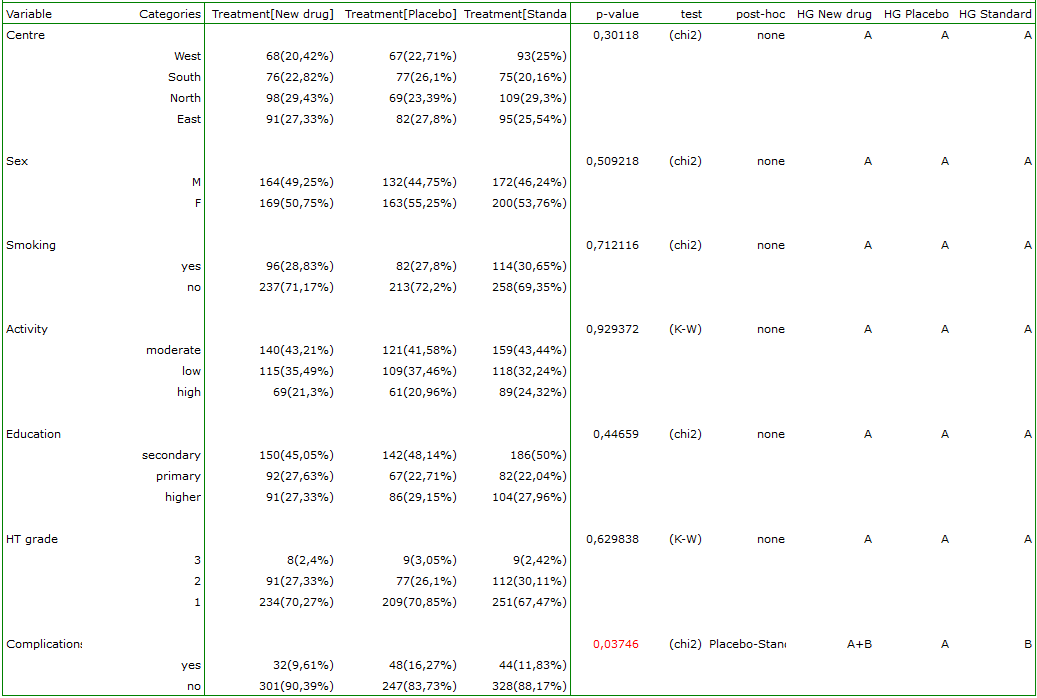
The same file allows a summary for two independent groups (grouping variable Sex or Smoking) and a summary for multiple groups by centre (Centre, four groups) or by hypertension grade (HT grade, three groups).
"Quantitative variables:
For the interval scale with normality of distribution in all groups and equality of variances, the one-way ANOVA for independent groups (ANOVA) was determined; when the variances of the groups differed, the Welch ANOVA (Welch) was determined. For the interval scale, when the condition of normality of distribution was not met, as for the ordinal scale, the Kruskal-Wallis ANOVA (K-W) was determined. Normality of the distribution was tested with the Shapiro-Wilk test and equality of variances with the Levene test. If the scale was not marked for the analyzed variables, it was assumed that the data came from the interval scale.
Qualitative variables:
For the nominal scale, the chi-square test (chi2) was determined, and when Cochran's condition was not met the Fisher exact test (Fisher exact) or, for 2x2 tables with a sample size greater than 40, the Yates correction (chi2-Yates) was determined. For the ordinal scale, the Kruskal-Wallis ANOVA (K-W) for category codes and the Conover test of equality of rank variances were determined. If the scale was not marked for the variables analyzed, it was assumed that the data came from the nominal scale.
Post-hoc tests:
Determined only for at least 3 groups and a significant main test: Tukey HSD (ANOVA), Tamhane T2 (Welch), Dunn with the Benjamini-Hochberg correction (K-W), pairwise group comparisons with the chi-square or Fisher exact test with the Benjamini-Hochberg correction (RxC tables). The post-hoc column lists the pairs of groups that differ significantly, and in the homogeneous groups (HG) columns the groups that do not differ significantly share a common letter."