 PQStat
The Kendall's concordance coefficient and a test to examine its significance
When to use:
The Kendall's \(\widetilde{W}\) coefficient of concordance (Kendall's Coefficient of Concordance), described in the works of Kendall and Babington-Smith (1939)[95] and Wallis (1939)[170], is used when we have rankings coming from different sources (from different raters) and concerning several (\(k\geq2\)) objects, and we want to assess the agreement of these rankings. It is often used to measure the strength of interrater reliability, i.e. the degree to which the raters' ratings agree.
Assumptions
- measurement on an ordinal scale or an interval scale.
Definitions of measures
The Kendall's \(\widetilde{W}\) coefficient of concordance – the value \(W\in\langle0;1\rangle\) is interpreted as follows:
- \(\widetilde{W}\approx1\) means strong agreement in the rating of individual objects by the raters;
- \(\widetilde{W}\approx0\) means no agreement in the rating of individual objects by the raters.
\(W\) denotes the Kendall concordance coefficient in the population, while \(\widetilde{W}\) denotes it in the sample.
The Kendall's \(\widetilde{W}\) coefficient of concordance versus the Friedman ANOVA: the Kendall's \(\widetilde{W}\) coefficient of concordance and the Friedman ANOVA are based on the same mathematical model. As a result, the value of the \(\chi^2\) test statistic for testing the significance of the Kendall coefficient of concordance and the value of the Friedman ANOVA test statistic are the same.
How to set up the analysis
Statistics \(\to\) Nonparametric tests \(\to\) Kendall's W (or via the Wizard).
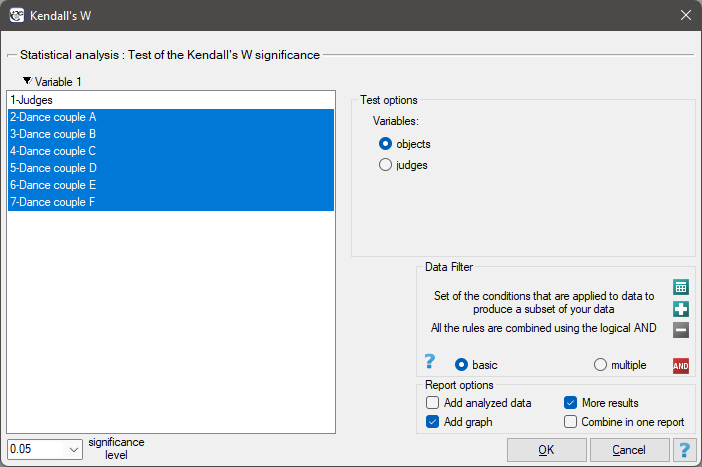
Performing and interpreting the analysis
Example 1. (judges.pqs file)
In the six-point system, 9 judges score dance couples on, among other things, artistic impression. The judges begin by comparing the competitors against each other and placing them at a given position (thereby creating a ranking). We will check whether the ranks assigned by the judges agree:
| Judges | Couple A | Couple B | Couple C | Couple D | Couple E | Couple F |
| S1 | 3 | 6 | 2 | 5 | 4 | 1 |
| S2 | 4 | 6 | 1 | 5 | 3 | 2 |
| S3 | 4 | 6 | 2 | 5 | 3 | 1 |
| S4 | 2 | 6 | 3 | 5 | 4 | 1 |
| S5 | 2 | 6 | 1 | 5 | 4 | 3 |
| S6 | 3 | 5 | 1 | 6 | 4 | 2 |
| S7 | 5 | 4 | 1 | 6 | 3 | 2 |
| S8 | 3 | 6 | 2 | 5 | 4 | 1 |
| S9 | 2 | 6 | 3 | 5 | 4 | 1 |
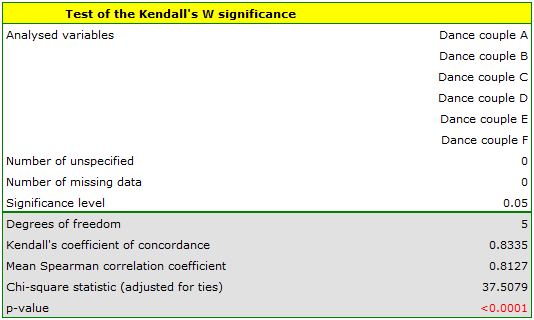
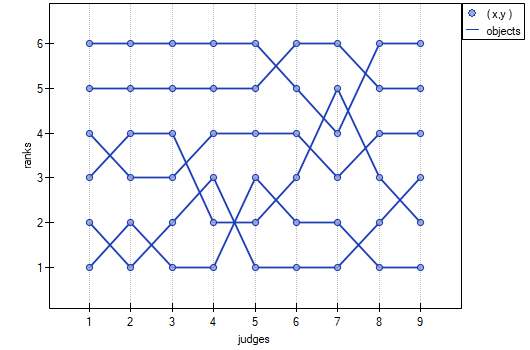
The strength of this agreement is high, at \(\widetilde{W}=0.83351\), as is the average Spearman monotonic correlation coefficient, \(\bar{r}_s=0.81270\). This result can be shown on a graph in which the X axis represents the successive judges. The more often the lines intersect (they should be parallel to the X axis when agreement is perfect), the weaker the agreement represented by the judges' ratings.
Formulas:
The value of the Kendall coefficient of concordance is calculated using the formula:
where:
\(n\) – the number of different sets of ratings (the number of raters),
\(k\) – the number of ranked objects,
\(\displaystyle U=\sum_{j=1}^k\left(\sum_{i=1}^nR_{ij}\right)^2\),
\(R_{ij}\) – ranks assigned to successive objects \((j=1,2,...k)\), separately for each rater \((i=1,2,...n)\),
\(\displaystyle C=\sum(t^3-t)\) – a correction for tied ranks,
\(t\) – the number of cases included in a tie.
The formula for the coefficient includes the correction for tied ranks, \(C\). This correction is used when tied ranks are present (when there are no tied ranks, the correction is not calculated, since then \(C=0\)).
The relationship between the average Spearman correlation coefficient and the Kendall coefficient of concordance is given by:
The \(\chi^2\) test for the significance of the Kendall coefficient of concordance
Hypotheses:
\(\begin{array}{cl} \mathcal{H}_0: & W=0 \\ \mathcal{H}_1: & W\neq0 \end{array}\)
Formulas:
The test statistic is defined by:
This statistic asymptotically (for large sample sizes) has the \(\chi^2\) distribution with the number of degrees of freedom calculated using the formula \(df=k-1\).
The \(p\) value, determined on the basis of the test statistic, is compared with the significance level \(\alpha\): if \(p \le \alpha\), we reject \(\mathcal{H}_0\) in favor of \(\mathcal{H}_1\); if \(p > \alpha\), there is no reason to reject \(\mathcal{H}_0\).