 PQStat
The monotonic correlation coefficients
When to use:
A monotonic relationship can be described as a monotonic increase or a monotonic decrease. The relationship between 2 features shows a monotonic increase if an increase in one feature is accompanied by an increase in the other, and a monotonic decrease if an increase in one feature is accompanied by a decrease in the other. The Spearman's rank-order correlation coefficient \(r_s\) and the Kendall's tau correlation coefficient \(\tilde{\tau}\) (Kendall (1938)[94]) are used to examine the strength of such a relationship between two features \(X\) and \(Y\).
Assumptions
- measurement on an ordinal scale or an interval scale.
Definitions of measures
The Spearman's rank-order correlation coefficient \(r_s\) – the value \(r_s\in\langle-1;1\rangle\) is interpreted as follows:
- \(r_s\approx1\) means a strong positive (increasing) monotonic relationship, i.e. an increase in the independent variable corresponds to an increase in the dependent variable;
- \(r_s\approx-1\) means a strong negative (decreasing) monotonic relationship, i.e. an increase in the independent variable corresponds to a decrease in the dependent variable;
- when the coefficient is equal or very close to zero, there is no monotonic relationship between the analysed features (a non-monotonic relationship, e.g. a sinusoidal one, may still exist).
\(R_s\) denotes the Spearman rank-order correlation coefficient in the population, while \(r_s\) denotes it in the sample.
The Kendall's tau correlation coefficient \(\tilde{\tau}\) – the value \(\tilde{\tau}\in\langle-1;1\rangle\) is interpreted as follows:
- \(\tilde{\tau}\approx1\) means a strong agreement in the ordering of ranks (an increasing monotonic relationship), i.e. an increase in the independent variable corresponds to an increase in the dependent variable;
- \(\tilde{\tau}\approx-1\) means a strong disagreement in the ordering of ranks (a decreasing monotonic relationship), i.e. an increase in the independent variable corresponds to a decrease in the dependent variable;
- when the coefficient is equal or very close to zero, there is no monotonic relationship between the analysed features (a non-monotonic relationship, e.g. a sinusoidal one, may still exist).
\(\tau\) denotes the Kendall correlation coefficient in the population, while \(\tilde{\tau}\) denotes it in the sample.
The Spearman \(r_s\) coefficient versus the Kendall \(\tilde{\tau}\) coefficient
- for an interval scale with normality of distribution of both features, the \(r_s\) value gives results closer to \(r_p\), while the \(\tilde{\tau}\) value may differ considerably from \(r_p\),
- the value of \(\tilde{\tau}\) is less than or equal to the value of \(r_p\),
- \(\tilde{\tau}\) is an unbiased estimator of the population parameter \(\tau\), while the value of \(r_s\) is not an unbiased estimator of the parameter \(R_s\).
Formulas:
The value of the Spearman rank-order correlation coefficient is calculated using the formula:
where:
\(d_i=R_{x_i}-R_{y_i}\) – the difference of ranks for feature \(X\) and feature \(Y\),
\(n\) – the number of \(d_i\).
This formula is modified when tied ranks are present:
where \(\Sigma_X=\frac{n^3-n-T_X}{12}\), \(\Sigma_Y=\frac{n^3-n-T_Y}{12}\), \(T_X=\sum_{i=1}^s (t_{i_{(X)}}^3-t_{i_{(X)}})\), \(T_Y=\sum_{i=1}^s (t_{i_{(Y)}}^3-t_{i_{(Y)}})\), and \(t\) is the number of cases included in a tie. The correction for ties should be used when ties are present – otherwise the formula reduces to the form described by the previous equation.
The value of the Kendall's tau correlation coefficient is calculated using the formula:
where:
\(n_C\) – the number of pairs of observations for which the values of the ranks of feature \(X\) and feature \(Y\) change in the same direction (the number of concordant pairs),
\(n_D\) – the number of pairs of observations for which the values of the ranks of feature \(X\) change in a different direction than those of feature \(Y\) (the number of discordant pairs),
\(T_X=\sum_{i=1}^s (t_{i_{(X)}}^2-t_{i_{(X)}})\), \(T_Y=\sum_{i=1}^s (t_{i_{(Y)}}^2-t_{i_{(Y)}})\), and \(t\) is the number of cases included in a tie.
The formula for \(\tilde{\tau}\) includes a correction for tied ranks. This correction should be used when ties are present (when there are no ties, the correction is not calculated, since then \(T_X=0\) and \(T_Y=0\)).
The \(t\)-test for the significance of the Spearman rank-order correlation coefficient
When to use this test:
The test of significance for the Spearman rank-order correlation coefficient lets you check whether a monotonic relationship exists between the analysed features of a population. It is based on the Spearman rank-order correlation coefficient \(r_s\) calculated for the sample – the closer the value of \(r_s\) is to 0, the weaker the monotonic relationship joining the analysed features.
Assumptions
- measurement on an ordinal scale or an interval scale.
How to set up the analysis
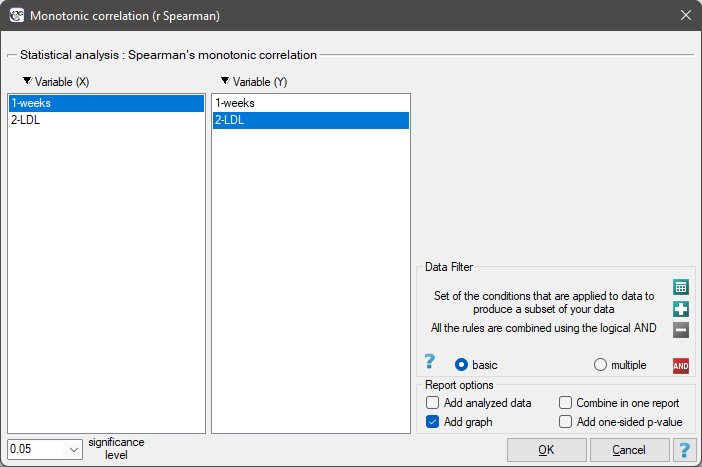
Statistics \(\to\) Nonparametric tests \(\to\) monotonic correlation (r-Spearman) (or via the Wizard).
Performing and interpreting the analysis
Example 1. (LDL weeks.pqs file)
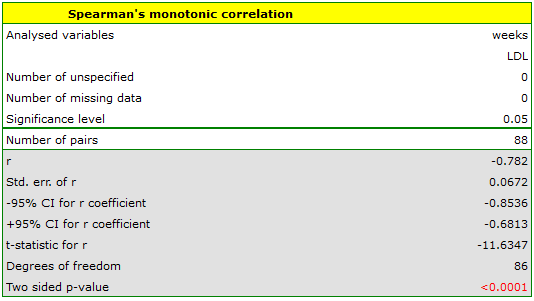
The effectiveness of a new therapy designed to lower LDL cholesterol levels was studied. 88 people at different stages of the treatment were examined. We will check whether LDL cholesterol levels fall and stabilize with the duration of treatment (time in weeks).
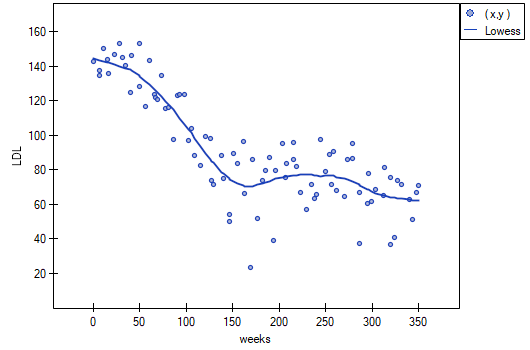
This relationship is initially decreasing, and after 150 weeks it begins to stabilize. The Spearman monotonic correlation coefficient, and thus the strength of the monotonic relationship, is fairly high at \(r_s=-0.7806\). The graph was drawn by fitting a curve using local LOWESS linear smoothing techniques.
Hypotheses:
\(\begin{array}{cl} \mathcal{H}_0: & R_s = 0, \\ \mathcal{H}_1: & R_s \ne 0. \end{array}\)
Formulas:
The test statistic is defined by:
where \(\displaystyle SE=\sqrt{\frac{1-r_s^2}{n-2}}\).
The value of the test statistic cannot be calculated when \(r_s=1\) or \(r_s=-1\), or when \(n<3\). The test statistic has the \(t\)-Student distribution with \(n-2\) degrees of freedom.
The \(p\) value, determined on the basis of the test statistic, is compared with the significance level \(\alpha\): if \(p \le \alpha\), we reject \(\mathcal{H}_0\) in favor of \(\mathcal{H}_1\); if \(p > \alpha\), there is no reason to reject \(\mathcal{H}_0\).
The test for the significance of the Kendall's tau correlation coefficient
When to use this test:
The test of significance for the Kendall's tau correlation coefficient lets you check whether a monotonic relationship exists between the analysed features of a population. It is based on the Kendall correlation coefficient calculated for the sample – the closer the value of \(\tilde{\tau}\) is to 0, the weaker the monotonic relationship joining the analysed features.
Assumptions
- measurement on an ordinal scale or an interval scale.
How to set up the analysis
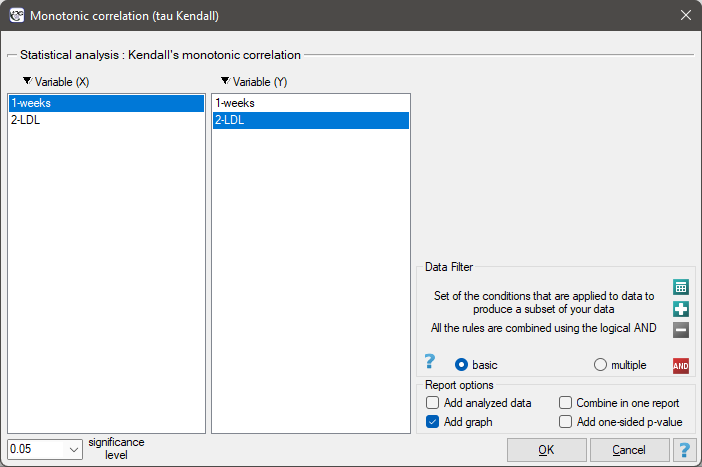
Statistics \(\to\) Nonparametric tests \(\to\) monotonic correlation (tau-Kendall) (or via the Wizard).
Performing and interpreting the analysis
Continuation of Example 1 (LDL weeks.pqs file): we check the same relationship between treatment time and LDL level, this time using the Kendall tau coefficient.
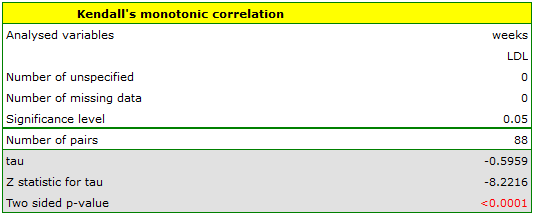
This relationship is initially decreasing, and after 150 weeks it begins to stabilize. The Kendall monotonic correlation coefficient, and thus the strength of the monotonic relationship, is fairly high at \(\tilde{\tau}=-0.5975\). The graph was drawn by fitting a curve using local LOWESS linear smoothing techniques.
Hypotheses:
\(\begin{array}{cl} \mathcal{H}_0: & \tau = 0, \\ \mathcal{H}_1: & \tau \ne 0. \end{array}\)
Formulas:
The test statistic is defined by:
The test statistic asymptotically (for large sample sizes) has the normal distribution.
The \(p\) value, determined on the basis of the test statistic, is compared with the significance level \(\alpha\): if \(p \le \alpha\), we reject \(\mathcal{H}_0\) in favor of \(\mathcal{H}_1\); if \(p > \alpha\), there is no reason to reject \(\mathcal{H}_0\).