 PQStat
The Fisher-Snedecor test
When to use this test:
The Fisher-Snedecor test checks whether two compared groups have similarly varied results (similar variability). It is usually used as a preliminary step before the \(t\)-test for independent groups – its result indicates whether to use the basic version of the \(t\)-test, or its variant with the Cochran-Cox correction.
Assumptions
- measurement on an interval scale,
- normality of distribution of the analysed variable in both populations,
- an independent model.
How to set up the analysis
Statistics \(\to\) Parametric tests \(\to\) F Fisher Snedecor.
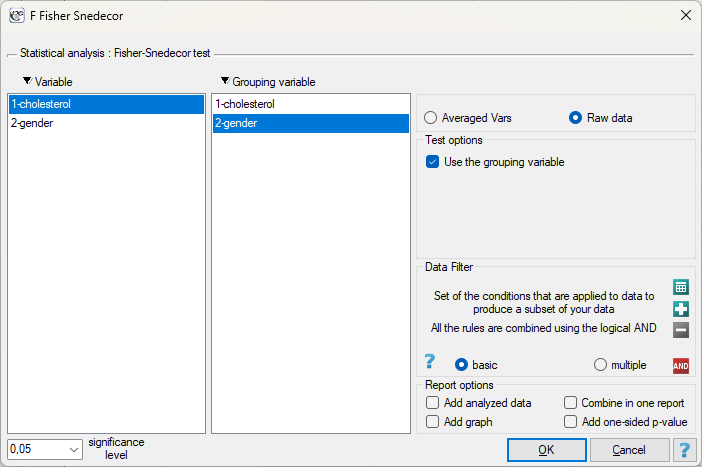
Performance and interpretation
Example 1. (cholesterol.pqs file)
A sample of 500 women and a sample of 500 men, living in Poland and aged over 40, were randomly selected from their respective populations. The study concerned the assessment of cardiovascular disease risk. Total cholesterol level was among the analysed parameters. Before comparing the mean values of this parameter between women and men, it is first checked whether the variances of total cholesterol level in the two populations are equal.
The distribution of total cholesterol level in both groups is a normal distribution (this was checked with the Lilliefors test). The standard deviation in the group of men was \(sd_1=47.6\) (\(n_1=500\)), and in the group of women \(sd_2=43.5\) (\(n_2=500\)).
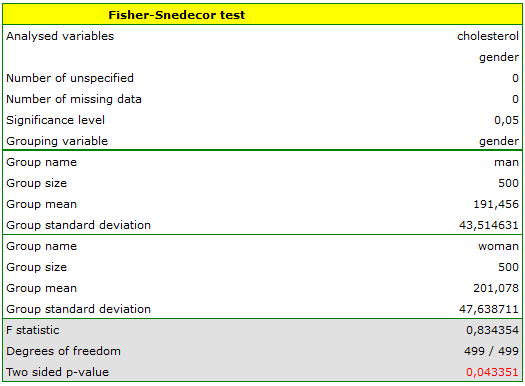
The \(p\) value, calculated on the basis of the test statistic, is always compared with the assumed significance level \(\alpha\): when \(p \le \alpha\), the difference in variances is statistically significant; when \(p > \alpha\), there is no reason to claim that the variances differ. This decision determines which version of the \(t\)-test for independent groups should be used in the next step of the analysis.
Hypotheses:
\(\begin{array}{cc} \mathcal{H}_0: & \sigma_1^2=\sigma_2^2,\\ \mathcal{H}_1: & \sigma_1^2\ne\sigma_2^2, \end{array}\)
where \(\sigma_1^2\), \(\sigma_2^2\) – variances of an analysed variable of the 1st and the 2nd population.
Formulas: The test statistic is defined by:
where \(sd_1^2\), \(sd_2^2\) – variances of an analysed variable of the samples chosen randomly from the 1st and the 2nd population. The test statistic has the F Snedecor distribution with \(n_1-1\) and \(n_2-1\) degrees of freedom.