 PQStat
Power and sample size for test
When to use:
Before conducting a study (or after having conducted it), it is worth knowing whether the statistical test used even had a chance of detecting the difference, relationship or dependency we are interested in. This is exactly what test power analysis and determining the required sample size are for.
When testing hypotheses, we can make two kinds of mistakes: conclude that something differs, even though there is in fact no difference (Type I error, denoted \(\alpha\)), or overlook a real difference, concluding that it does not exist (Type II error, denoted \(\beta\)). Test power is the ability of a test to detect a difference, relationship, agreement or other dependency described in the alternative hypothesis – in other words, it is the probability that the test correctly „notices” an effect that truly exists in the population. Not all tests are equally effective – some are „more sensitive” (more powerful), others „less sensitive” (weaker), so when several tests are available for the same problem, it is worth choosing the one with greater power.
Test power can be checked a priori, i.e. before collecting data – then we are planning how many people/objects we will need to have a real chance of detecting the effect we are interested in. It can also be done a posteriori, i.e. after collecting the sample – this is often done by paper reviewers or by the researchers themselves, to assess how credible the obtained (especially statistically non-significant) result is. Low power means that the results may be ambiguous – another researcher repeating the experiment could easily obtain a different result. High power means that the result is solid – it will be difficult to challenge it. For example: if, using a test with 80% power, we show that two groups of students differ statistically significantly in the number of correctly solved tasks, this means that when repeating the same experiment (the same sample size, the same test, the same significance level), other researchers would confirm this difference in 80% of cases.
In PQStat, we can go two ways: calculate test power, by specifying the sample size, or calculate the required sample size, by specifying the test power we want to achieve.
Assumptions
- knowledge of the rules for using the test for which we are calculating power or sample size (its hypotheses, assumptions, way of interpreting the result),
- the ability to determine the effect size that we want to be able to detect – ideally based on pilot data, earlier studies, or subject-matter knowledge about the phenomenon under study.
Definitions of measures
Test power and the required sample size are closely related to each other, and additionally depend on several other elements that need to be determined:
- Effect size \(ES\) – that is, how large a difference, relationship or agreement we consider worth detecting. The larger the effect, the easier it is to demonstrate – so the test power increases and the required sample size decreases. For example, it is easier to convince someone that two groups differ when the difference is five correctly solved tasks than when it is only one task. The effect size usually has to be standardized (e.g. using the standard deviation or a correlation coefficient), so additional information about the variability of the data is often needed for the calculation.
- Statistical significance level \(\alpha\) (Type I error) – the higher the significance level, the greater the test power. However, this is an element over which we have only apparent control – there are rarely situations in which we are allowed to change it freely, and if we are, it is usually in the direction of decreasing it (see Multiple comparisons). By convention, \(\alpha=0.05\) is used.
- Direction of the hypothesis, i.e. a two-sided hypothesis (equality in the null hypothesis) or a one-sided hypothesis (a \(<\) or \(>\) sign in the null hypothesis). A one-sided hypothesis gives greater power, but is used less often – in practice we rarely assume in advance that one group has no chance at all of „beating” the other; more often we give both groups equal chances.
- Test power is expressed by the simple formula \(Power=1-\beta\), where \(\beta\) (Type II error) is the probability of accepting the null hypothesis when it is in fact false.
Test power is also closely related to the sample size \(n\) – the larger the sample, the greater the power: the more people/objects we collect for the study, the easier it will be to demonstrate that the detected differences between groups are not the result of chance, but actually occur in the populations. Therefore, instead of (or alongside) test power, a researcher may want to determine the required sample size needed to achieve a given test power for a given effect size.
How to set up the analysis
The window with the settings for test power and the required sample size for the selected test is opened via the menu Advanced statistics\(\to\)Test power and sample size\(\to\)Power and sample size for test.
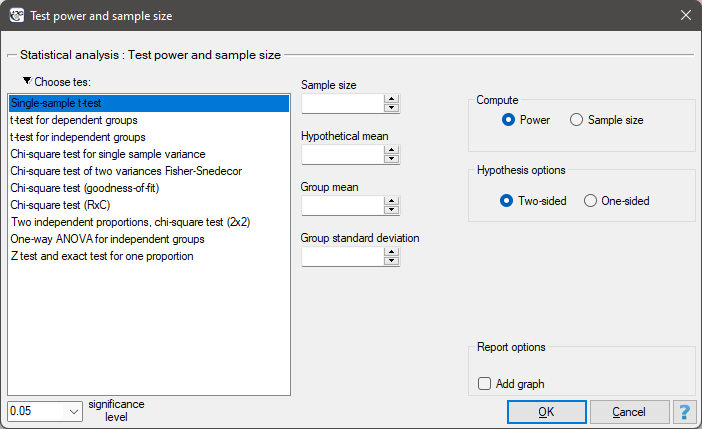
Power analysis is directly related to specific statistical tests, so in this window we first choose the test we are interested in, and then – depending on our needs – provide the sample size (to obtain test power) or the desired test power (to obtain the required sample size), as well as other information specific to the given test: the effect size (or the data from which it can be calculated), the significance level \(\alpha\) and the direction of the hypothesis. Below, the data required for the power and sample size analysis for each test available in the program is described in detail, together with examples of its application.
Single-sample t-test
When to use:
We perform the power and required sample size analysis for the single-sample t-test when we are planning (or have already performed) a comparison of a sample mean with a given hypothetical value, and want to know how large a sample to collect (or what power we have to detect a difference). Before starting the calculations, it is worth becoming familiar with the rules for using this test.
In this case, the given effect size is the size of the difference between the mean of the studied population and the hypothetical mean value. Test power and the required sample size are calculated based on the noncentral t-distribution.
How to set up the analysis
To determine the test power and the required sample size, we need to provide:
| Test power | Group size |
| Group size | Test power |
| Hypothetical mean | |
| Group mean | |
| Group standard deviation | |
| Significance level \(\alpha\) | |
Performing and interpreting the analysis
Example 1. We want to check (at a significance level of 0.05) whether the average waiting time for a delivery from a certain courier company is 3 days (i.e. 72 hours).
A priori study – we are planning to conduct a study, but have not yet collected data. We set the test power we want to achieve at 80%. The standard deviation we provide should reflect the differences in delivery time we expect in the planned study – we assume (based on the experience of the company's employees) that it will be 1 day (24 h).
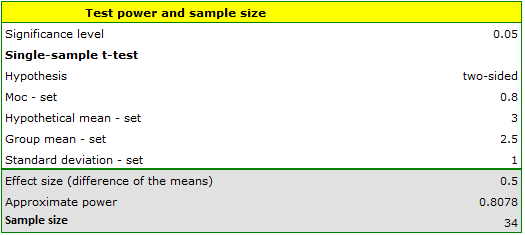
a) What will be the required sample size if we assume that the effect size at which we would like to obtain statistical significance is 12 hours (0.5 days)?
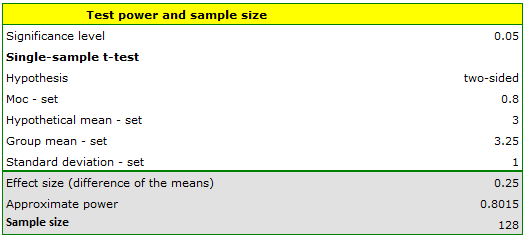
b) What will be the required sample size if we assume that the effect size at which we would like to obtain statistical significance is 6 hours (0.25 days)?
Answer a) We know that the range from 2.5 to 3.5 days falls within the accepted margin of error. So we enter 3 days as the hypothetical mean and 2.5 days (or 3.5 days) as the mean of the studied group.
Answer b) We know that the range from 2.75 to 3.25 days falls within the accepted margin of error. So we enter 3 days as the hypothetical mean and 2.75 days (or 3.25 days) as the mean of the studied group.
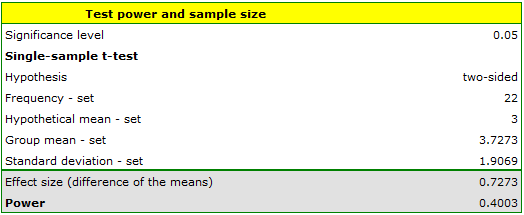
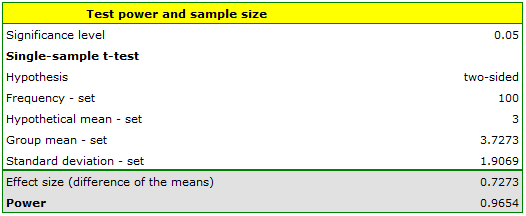
A posteriori study – we have collected data for the study – our sample contains 22 deliveries (data in the file kurier.pqs). Based on the collected data we determine the mean number of days waiting for delivery and the standard deviation of the group. In our case these are: mean=3.727273, deviation=1.906925.
a) What is the power of the analysis performed?
b) What would the power be if we increased the sample size to 100, leaving the remaining assumptions unchanged?
Answer a) The power of the analysis performed is only 0.400302.
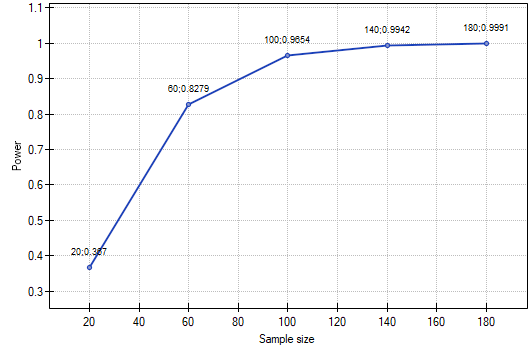
Answer b) The power of our analysis will increase to 0.965364 when its sample size increases to 100 elements and the assumptions of the analysis do not change.
How the power of the analysis changes with a changing sample size, with the other assumptions unchanged, can be seen on the chart.
T-test for dependent groups
When to use:
We perform the power and required sample size analysis for the t-test for dependent groups when planning or evaluating a study in which the same people/objects are measured twice (e.g. before and after an intervention). Before starting the calculations, it is worth becoming familiar with the rules for using this test.
In this case, the given effect size is the size of the difference between the means that we expect to obtain in the population. Test power and the required sample size are calculated based on the noncentral t-distribution.
How to set up the analysis
To determine the test power and the required sample size, we need to provide:
| Test power | Group size |
| Group size | Test power |
| Group (study) mean 1 | |
| Group (study) mean 2 | |
| Standard deviation of the difference | |
| (or deviations of both groups | |
| and Pearson correlation coefficient) | |
| Significance level \(\alpha\) | |
Performing and interpreting the analysis
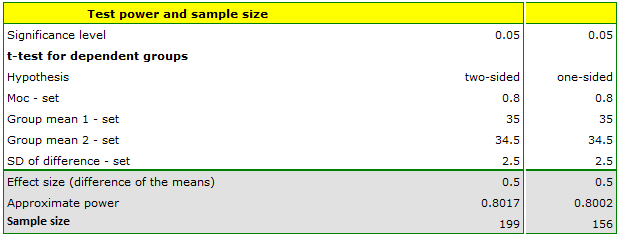
Example 2. We want to check (at a significance level of 0.05) whether treating an eating disorder at a certain clinic produces a significant reduction in body weight after just 30 days of following a new type of diet. We consider a change in BMI of half a unit to be a significant change in body weight. How large a sample should be collected for a difference of this magnitude to be statistically significant in a t-test for dependent groups?
Since we do not have data from a pilot study, we will base the basic data for the calculations on the experience and estimates of the clinic staff. We assume that the average BMI of a treated person is 35 – we enter this value in the box for the first mean. Since a change in BMI of less than half a unit is not clinically significant, only a decrease below 34.5 (or an increase above 35.5) will be considered significant. So we enter the value 34.5 (or 35.5) as the second mean. We presume that the standard deviation of the difference (BMI before and BMI after) may be quite large, since the group will usually include people who are disciplined about following the diet, and those who nevertheless allow themselves extra snacks between meals. We therefore set the deviation at 2.5. The power of the analysis we want to obtain is 80%.
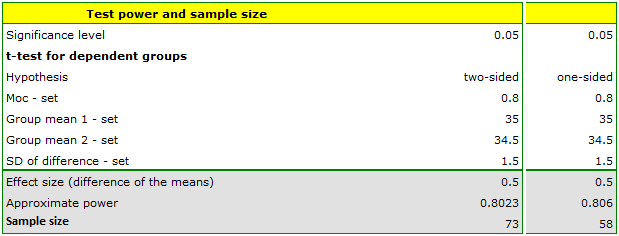
If we assumed that the group would be more disciplined and the standard deviation of the difference would be 1.5 BMI units, then the sample could be slightly smaller.
T-test for independent groups
When to use:
We perform the power and required sample size analysis for the t-test for independent groups when planning or evaluating a study comparing means in two independent groups (e.g. ill and healthy). Before starting the calculations, it is worth becoming familiar with the rules for using this test.
In this case, the given effect size is the size of the difference between the means that we expect to obtain between the populations. Test power and the required sample size are calculated based on the noncentral t-distribution.
How to set up the analysis
To determine the test power and the required sample size, we need to provide:
| Test power | Group size |
| Group size 1 | Test power |
| Group size 2 | |
| Group mean 1 | |
| Group mean 2 | |
| Common standard deviation | |
| (or deviations of both groups*) | |
| Significance level \(\alpha\) | |
Performing and interpreting the analysis
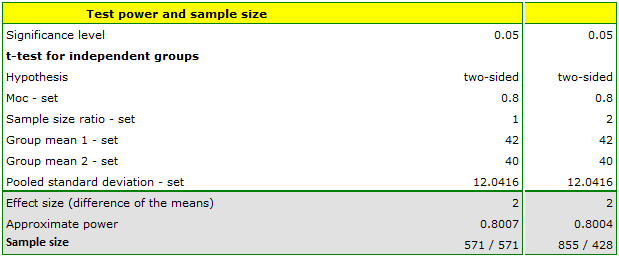
Example 3. We are studying men suffering from disease X and healthy men. We want to check (at a significance level of 0.05) whether the ill differ from the healthy in HDL cholesterol level. We consider a difference of 2 mg/dl to be clinically significant. How large a sample should be collected for a difference of this magnitude to be statistically significant in the t-test for independent groups?
We enter 40 mg/dl as the mean HDL for ill men and 42 mg/dl for healthy men. We set the ratio of the two group sizes to 1, since we assume equal group sizes. We have data from a pilot study, so we provide the standard deviations for the ill (13 mg/dl) and healthy (11 mg/dl), indicating the additional options  . The power of the analysis we want to obtain is 80%.
Chi-square test for single sample variance
When to use:
We perform the power and required sample size analysis for the chi-square test for single sample variance when planning or evaluating a study comparing the variability (standard deviation) in a sample with a given hypothetical value. Before starting the calculations, it is worth becoming familiar with the rules for using this test.
In this case, the given effect size is the ratio of the standard deviation of the studied population to the hypothetical standard deviation. Test power and the required sample size are calculated based on the chi-square distribution.
How to set up the analysis
To determine the test power and the required sample size, we need to provide:
| Test power | Group size |
| Group size | Test power |
| Hypothetical standard deviation | |
| Group standard deviation | |
| Significance level \(\alpha\) | |
Performing and interpreting the analysis
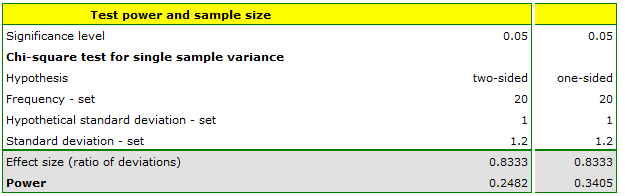
Example 4. Before starting production of the next batch of a certain cough syrup, control measurements should be taken of the volume of syrup poured into bottles. The bottles should contain 200 ml of syrup. According to the technical documentation of the dispensing device, the permissible spread of syrup volume, measured by the standard deviation, is 1 ml. It should be checked (at a significance level of 0.05) whether the tested device is working correctly. Will a sample of 20 bottles be sufficient to demonstrate an excessive device error, if one exists? A standard deviation exceeding 1.2 ml is considered an excessive device error.
Since we expect the standard deviation of the dispensing device to match the documentation, we enter the value 1 ml as the hypothetical value. An excessive error occurs when the deviation exceeds 1.2 ml, and we enter this value in the field for the standard deviation of the group of bottles we are going to test.
If the sample consists of 20 bottles, the resulting power for the two-sided hypothesis is only 0.25, and for the one-sided hypothesis 0.34.
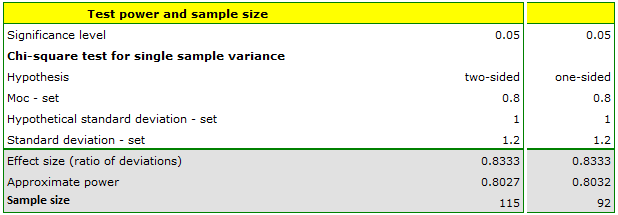
We would like to obtain a standard power. To obtain a power of 80%, we change the program settings and calculate the required sample size.
Chi-square test of two variances, Fisher-Snedecor
When to use:
We perform the power and required sample size analysis for the Fisher-Snedecor test when planning or evaluating a study comparing the variability (standard deviation) between two independent samples. Before starting the calculations, it is worth becoming familiar with the rules for using this test.
In this case, the given effect size is the ratio of the standard deviation of the first population to that of the second. Test power and the required sample size are calculated based on the F-Snedecor distribution.
How to set up the analysis
To determine the test power and the required sample size, we need to provide:
| Test power | Group size |
| Group size 1 | Test power |
| Group size 2 | |
| Group 1 standard deviation | |
| Group 2 standard deviation | |
| Significance level \(\alpha\) | |
Performing and interpreting the analysis
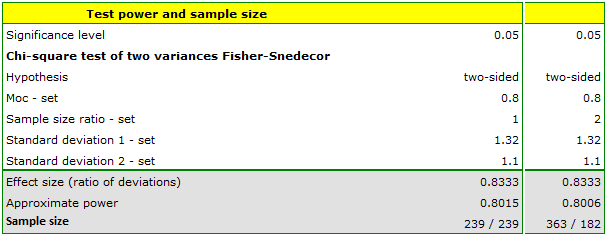
Example 5. Before starting production of the next batch of a certain cough syrup, control measurements should be taken of the volume of syrup poured into bottles. The bottles should contain 300 ml of syrup. Two dispensing devices are used at the bottling plant. We want to check (at a significance level of 0.05) whether the spread of syrup volume, measured by the standard deviation, is the same for both devices. A small pilot study was conducted, and it was established that the standard deviation for the first device is 1.32, and for the second 1.1. If the difference is small, i.e. the ratio of the two deviations is below 1.2 (as in the pilot study), both devices will be used interchangeably; if not, the one with the smaller deviation from the mean will be chosen. How many randomly selected bottles should be measured to be able to show that a ratio of 1.2 is statistically significant?
We enter the values of the standard deviations obtained in the pilot study and assume 80% test power.
Chi-square test of goodness of fit
When to use:
We perform the power and required sample size analysis for the chi-square goodness-of-fit test when planning or evaluating a study checking whether the distribution of data in a sample agrees with an expected (theoretical or hypothetical) distribution. Before starting the calculations, it is worth becoming familiar with the rules for using this test.
In this case, the given effect size, \(\phi\), is the square root of the ratio of the chi-square test statistic to the size of the studied group – the formula is given in the „For those interested” section at the end of the chapter. Test power and the required sample size are calculated based on the noncentral chi-square distribution.
How to set up the analysis
To determine the test power and the required sample size, we need to provide[47]:
| Test power | Group size |
| Group size | Test power |
| Number of categories | |
| Effect size \(\phi\) | |
| Significance level \(\alpha\) | |
Chi-square test (RxC)
When to use:
We perform the power and required sample size analysis for the chi-square test for RxC tables when planning or evaluating a study checking the relationship between two categorical variables shown in a table with several rows and columns. Before starting the calculations, it is worth becoming familiar with the rules for using this test.
In this case, the given effect size, \(\phi\), is the square root of the ratio of the chi-square test statistic to the size of the studied group – the formula is given in the „For those interested” section at the end of the chapter. Test power and the required sample size are calculated based on the noncentral chi-square distribution.
How to set up the analysis
To determine the test power and the required sample size, we need to provide[47][132]:
| Test power | Group size |
| Group size | Test power |
| Number of categories (rows) | |
| Number of categories (columns) | |
| Effect size \(\phi\) | |
| Significance level \(\alpha\) | |
Performing and interpreting the analysis
Example 6. There are plans to conduct a broad study showing the state of knowledge of the Polish population about ways of fighting common viruses. As part of the project, it should be established whether educational activities informing about the ineffectiveness of antibiotic therapy in viral infections were equally effective in the older age group (i.e. over 50 years old) as in younger adults (18-50 years old). A pilot study was conducted, and a randomly selected sample of 200 people was asked the question: „Do antibiotics fight viruses?”. Respondents could choose one of three answers: „no”, „I don't know”, „yes”. The results of the pilot study were prepared for publication. Below is an excerpt from the description included in the paper:
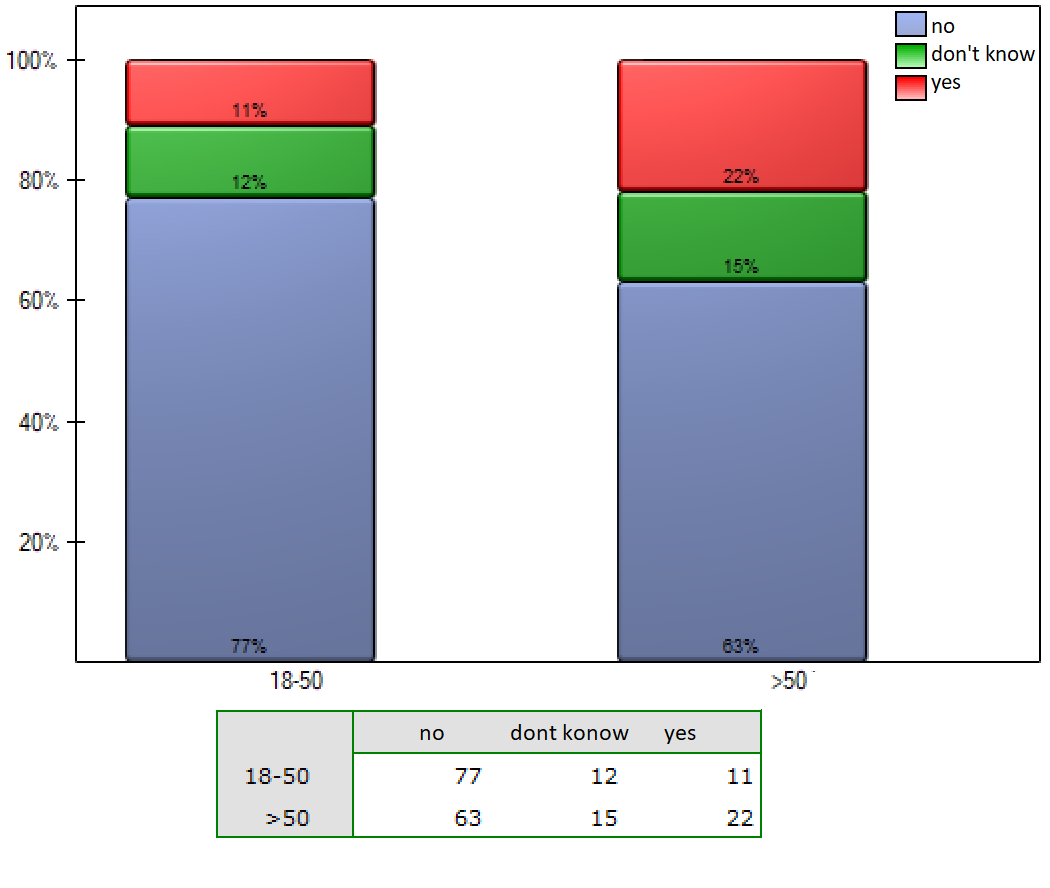
The p-value obtained in the chi-square test was statistically non-significant: p=0.0672. The paper's reviewer was rightly surprised by the fact that twice as many people over 50 incorrectly indicated that antibiotics fight viruses (22% versus 11%), yet this difference was not statistically significant.
As suggested by the reviewer, it should be checked whether the lack of statistical significance of this difference is due to too low a test power, and how large a sample should be to obtain, with the same percentages, a chi-square test power of 80%.
Preparing an answer for the reviewer
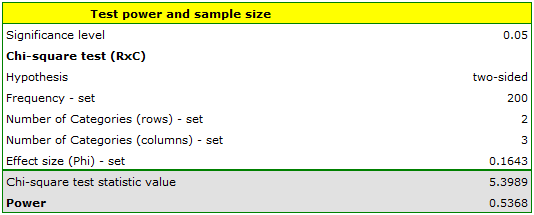
We will determine the \(\phi\) coefficient for the obtained test (menu: Chi-square, Fisher, OR/RR\(\to\)Correlation coefficients...\(\to\)Phi). We obtain \(\phi\)=0.1643. Based on a 200-element sample, with data placed in a table with two rows and three columns, and the given value of the \(\phi\) coefficient, we determine the power of the chi-square test.
If, for a sample of a different size, we obtain the same distribution of data, this means that we also obtain the same coefficient \(\phi\). To determine the sample size that would give us 80% power of the chi-square test, we again enter the coefficient \(\phi\)=0.1643.
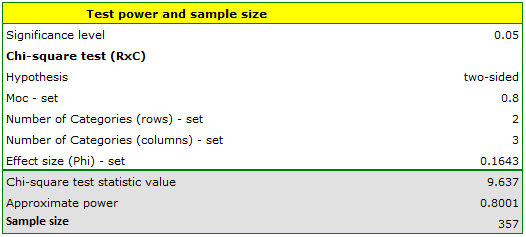
Already at this point we notice that when the undecided respondents (i.e. those who chose the answer „I don't know”) are omitted and the analysis is repeated, significant differences can be shown (chi-square, p=0.0251). In the group of decided respondents, the percentages choosing the incorrect answer are more than twice as high to the disadvantage of people over 50 years old (12.5% vs 25.9%).
Test for two independent proportions, chi-square (2x2)
When to use:
We perform the power and required sample size analysis for the chi-square test for 2x2 tables and the Z test for two independent proportions when planning or evaluating a study comparing two percentages (proportions) in two independent groups. Before starting the calculations, it is worth becoming familiar with the rules for using both these tests.
In this case, the given effect size is the difference between the specified proportions. Test power and the required sample size are calculated based on the normal distribution.
How to set up the analysis
To determine the test power and the required sample size, we need to provide[37]:
| Test power | Group size |
| Group size | Test power |
| Specified proportion in the first group | |
| Specified proportion in the second group | |
| Significance level \(\alpha\) | |
Performing and interpreting the analysis
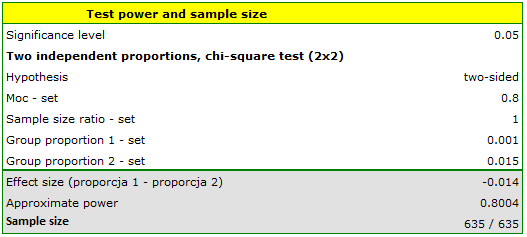
Example 7. Consider a study evaluating the effectiveness of aspirin in reducing mortality due to myocardial infarction. Earlier studies indicate that the percentage of deaths due to myocardial infarction is 0.015 for non-users and 0.001 for users of aspirin. The researchers want to determine the minimum sample size required to detect an absolute difference of \(|0.001-0.015|=0.014\) with 80% power using a two-sided test at a significance level of 5%.
One-way ANOVA for independent groups
When to use:
We perform the power and required sample size analysis for one-way ANOVA for independent groups when planning or evaluating a study comparing means in three or more independent groups. Before starting the calculations, it is worth becoming familiar with the rules for using this method.
In this case, the given effect size is RMSSE, i.e. a standardized measure used in ANOVA to describe the overall level of effect in the population. Test power and the required sample size are calculated based on the noncentral F-Snedecor distribution.
How to set up the analysis
To determine the test power and the required sample size, we need to provide:
| Test power | Group size |
| Group size | Test power |
| Group 1 mean | |
| Group 2 mean | |
| Group 3 mean | |
| Group 4 mean | |
| Group 1 standard deviation | |
| Group 2 standard deviation | |
| Group 3 standard deviation | |
| Group 4 standard deviation | |
| Significance level \(\alpha\) | |
Performing and interpreting the analysis
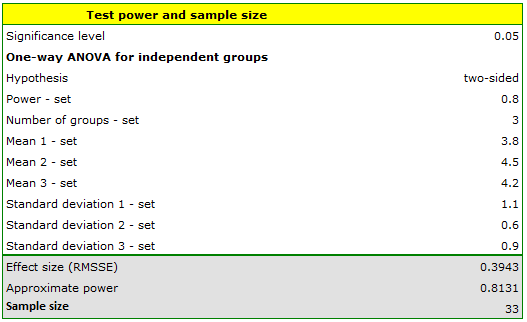
Example 8. The FVC parameter was studied for patients with heart defects (heart defect A, heart defect B and heart defect C). We want to find out (at a significance level of 0.05) whether the patients differ in the values of this parameter. To check this, a pilot study was first conducted. Based on the results of this study, the expected effect sizes were established, i.e.:
– for heart defect A: mean = 3.8, standard deviation = 1.1,
– for heart defect B: mean = 4.5, standard deviation = 0.6,
– for heart defect C: mean = 4.2, standard deviation = 0.9.
How many people should be collected, if these quantities remain at the same level, to prove that there are statistically significant differences?
We enter the values of the means and standard deviations.
Test for one proportion
When to use:
We perform the power and required sample size analysis for the test for one proportion when planning or evaluating a study comparing a proportion (percentage) in a sample with a given expected value. Before starting the calculations, it is worth becoming familiar with the rules for using this test.
In this case, the given effect size is the size of the difference between the specified proportion in the studied population and the hypothetical, expected proportion. Test power and the required sample size are calculated based on the normal distribution, when using the asymptotic test, or the binomial distribution, when using the exact test.
How to set up the analysis
To determine the test power and the required sample size, we need to provide:
| Test power | Group size |
| Group size | Test power |
| Expected proportion | |
| Group proportion | |
| Significance level \(\alpha\) | |
Performing and interpreting the analysis
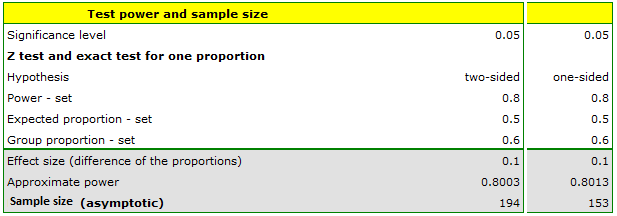
Example 9. 10 randomly selected families with children under 10 years old, living in Poznań, were asked about the planned educational future of their children. Of these, 6 families planned to educate their children at university. How large a sample would we need to collect to be able to state, at a significance level of 0.05 and a test power of 0.8, that more than 50% of families in Poznań with children under 10 years old already plan to have their children educated at university in the future?
We enter 0.5 as the expected proportion, and 0.6 as the group proportion.
T-test for independent groups – common standard deviation
Formulas: when the sizes of both groups are known, the common standard deviation is given by the formula:
when the sizes are not known, the simplified Cohen formula is used (Cohen, J. (1988)[47]):
where:
\(n_1, n_2\) – the sizes of the first and second sample,
\(sd_1, sd_2\) – the standard deviations in the first and second sample.
Chi-square goodness-of-fit test and chi-square test (RxC) – effect size \(\phi\)
Formulas: the given effect size \(\phi\) is the square root of the ratio of the chi-square test statistic to the size of the studied group: