 PQStat
 Comparing mixed logistic regression models
When to use:
Model comparison serves to choose the set of independent variables (fixed effects), as in comparing logistic regression models: we compare a full model with a reduced model, or use automatic selection (backward, forward, stepwise, subsets). The random structure is shared by all compared models: the random intercept, random slopes and covariance set in the window apply to every model, and a variable with a random slope stays in every model as a fixed effect. Selection concerns the fixed effects only; whether a random slope is needed is decided by the LR test in the mixed logistic regression report.
Definitions of measures
Models are compared with the information criteria AIC, AICc, BIC (the smaller, the better), pseudo-\(R^2\) and the marginal and conditional \(R^2\), and nested models – with the likelihood ratio test: \(2(\ell_{full}-\ell_{reduced})\) follows a \(\chi^2\) distribution with degrees of freedom equal to the number of removed variables. The likelihood is always approximated by the same method (Laplace or quadrature) in all models, so it is comparable.
How to set up the analysis
Statistics \(\to\) Mixed models \(\to\) Mixed logistic regression – comparing models.
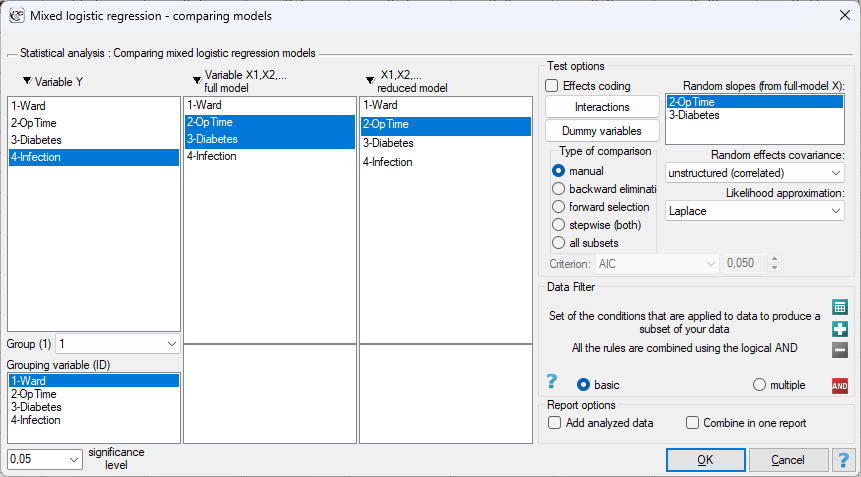
We indicate the dependent variable \(Y\) with the event value (Group (1)), the variables of the full and reduced models (or the selection criterion) and the mixed-model options: Grouping variable (ID), Random slopes (from full-model X), Random effects covariance and Likelihood approximation – all shared by the compared models.
Results and interpretation
The report contains a frame describing the shared random structure, the table Information criteria and LR tests with \(-2LL\), AIC, AICc, BIC, marginal and conditional \(R^2\) of each model and the LR test between successive models, and the coefficient tables of the models with conditional odds ratios and the random-effect variance of each model.
Example 1. (wardsInfections.pqs file)
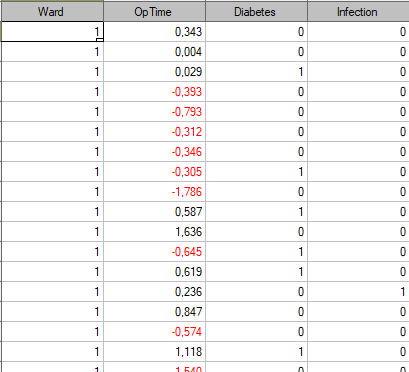
Simulated data: in 40 surgical wards, 25 patients each were observed after surgery. For each patient it was recorded whether a surgical site infection occurred (Infection: 1 – yes), the standardized duration of the operation (OpTime: 0 means an average duration, 1 – one standard deviation longer) and the presence of diabetes (Diabetes: 1 – yes). In total 1000 patients, 404 infections. Patients of the same ward share staff, procedures and theatre conditions, so the ward is the grouping variable. Since the effect of operation time may depend on the ward (in some wards long operations are routine, in others a sign of complications), operation time receives a random slope. We ask whether diabetes adds anything beyond operation time.
We set Infection as \(Y\) with the value 1 in the Group (1) field, Ward as the grouping variable, full model: OpTime and Diabetes, reduced model: OpTime only. In the Random slopes (from full-model X) list we select OpTime (this variable will stay in both models), covariance unstructured (correlated), approximation Laplace.
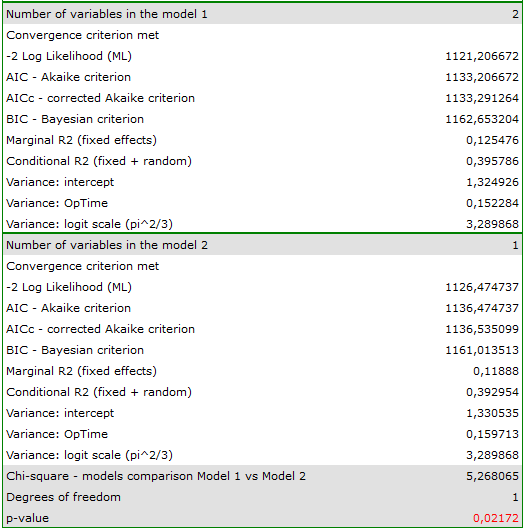
The full model has \(-2LL=1121.21\), AIC \(=1133.21\), BIC \(=1162.65\); the reduced model \(-2LL=1126.47\), AIC \(=1136.47\), BIC \(=1161.01\). LR test: \(\chi^2=1126.47-1121.21=5.27\), \(df=1\), \(p=0.022\) – removing diabetes significantly worsens the fit, AIC points to the full model, and BIC (which penalizes parameters more severely) to the reduced model, but the difference is small (1.6). In the coefficient table of the full model diabetes has a conditional \(OR=1.43\) (95% CI: 1.05–1.95, \(p=0.022\)): for patients of the same ward, at the same operation time, diabetes increases the odds of infection by 43%. Operation time: \(OR=2.27\) (1.82–2.84) per standard deviation. We keep the full model – the LR test agrees with the Wald test, and the effect of diabetes is clinically meaningful.
Random structure. Both models have a random-intercept variance of about 1.33 (standard deviation 1.15 on the logit scale – the wards differ greatly in baseline risk) and a random-slope variance of about 0.15 (standard deviation 0.39: the effect of operation time varies between wards from about \(0.82-0.78=0.04\) to \(0.82+0.78=1.60\) on the logit scale). The LR test of the slope in the mixed logistic regression report gives \(p=0.095\), so the evidence for different slopes is weak; the model with a random intercept only has AIC \(=1133.11\), practically equal to the model with the slope. The version with the independent covariance (the correlation is \(-0.06\) anyway) has the lowest AIC \(=1131.24\) and would be the most parsimonious choice.