 PQStat
 Comparing mixed multiple regression models
When to use:
Model comparison serves to choose the set of independent variables (fixed effects) that describes the data best with as few parameters as possible. It works like comparing multiple regression models: we compare a full model with a reduced model (without some of the variables), or let the program select the model automatically (backward, forward, stepwise or subset selection).
In mixed models one additional rule applies: the random structure is shared by all compared models. Selection concerns the fixed effects only, and the random intercept, random slopes and covariance type set in the window remain in every model. A variable that has been given a random slope stays in every compared model as a fixed effect (one cannot remove the fixed effect of a variable while keeping its random slope). Whether the random effects themselves are needed is decided by the LR tests in the mixed multiple regression report.
Definitions of measures
Models are compared with the information criteria AIC, AICc and BIC (the smaller, the better) and, for nested models, with the likelihood ratio test (LR): the statistic \(2(\ell_{full}-\ell_{reduced})\) follows a \(\chi^2\) distribution with degrees of freedom equal to the number of removed variables. A non-significant result means that the removed variables carry no information and the simpler model should be chosen; a significant result – that the full model is significantly better.
How to set up the analysis
Statistics \(\to\) Mixed models \(\to\) Mixed multiple regression – comparing models.
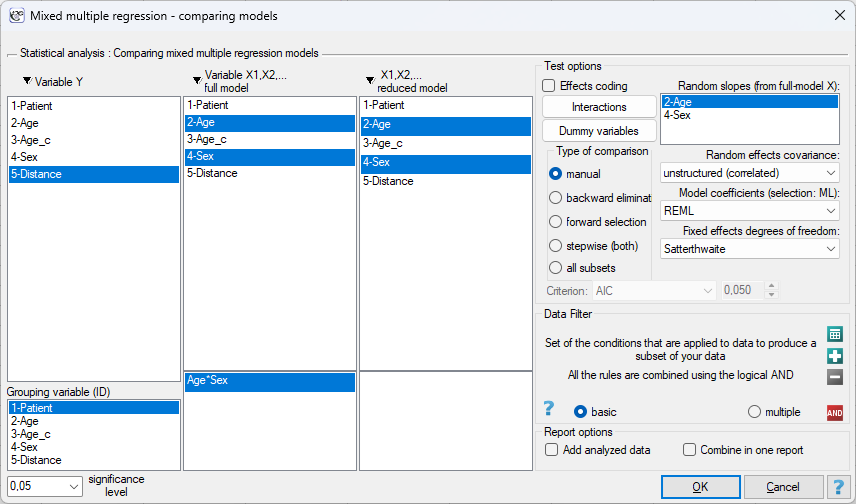
In the window we indicate the dependent variable \(Y\), the variables of the full model and of the reduced model (or the automatic selection criterion), as in comparing multiple regression models. Mixed-model options:
- Grouping variable (ID) – the column identifying the group; shared by all models,
- Random slopes (from full-model X) – variables whose effect differs between groups; such a variable stays in every compared model,
- Random effects covariance – independent or unstructured (correlated), shared by all models,
- Model coefficients (selection: ML) – REML or ML for the coefficient tables; the selection itself is always ML,
- Fixed effects degrees of freedom – Satterthwaite or Wald z test in the coefficient tables.
Results and interpretation
The report contains a frame describing the shared random structure (grouping variable, number of groups, random components, covariance), the table Information criteria and LR tests with \(-2LL\) (ML), AIC, AICc, BIC, marginal and conditional \(R^2\) of each model and the LR test between successive models, and the coefficient tables of the compared models (conditional fixed effects, with the random-effect variances of each model). If a singular fit occurred for any model, it is marked in the table.
Example 1. continuation of example 2 (orthodontics.pqs file)
The growth model of the pituitary–pterygomaxillary fissure distance contained: age, sex and the interaction age\(\times\)sex. We check whether the interaction (different growth rates of girls and boys) is really needed, comparing the full model with a reduced model without the interaction. Random structure: random intercept and random slope of age, unstructured covariance, shared by both models.
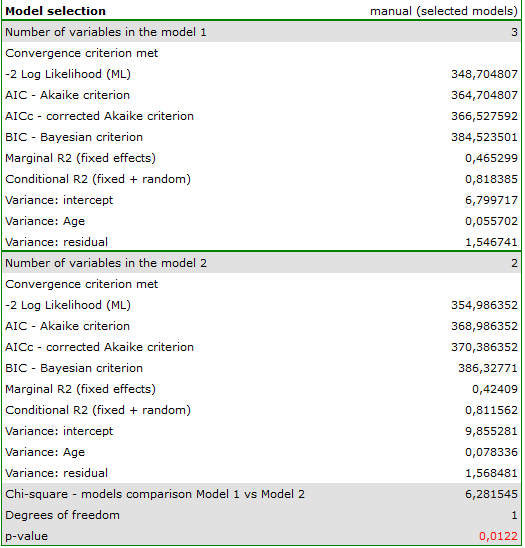
The full model has \(-2LL=348.70\) (ML), AIC \(=364.70\), BIC \(=384.52\); the model without the interaction \(-2LL=354.99\), AIC \(=368.99\), BIC \(=386.33\). LR test: \(\chi^2=354.99-348.70=6.28\), \(df=1\), \(p=0.012\) – removing the interaction significantly worsens the fit, and both information criteria point to the full model. We keep the model with the interaction: girls and boys grow at different rates. If we additionally compared the model with age only (\(-2LL=360.72\), AIC \(=372.72\)), it would turn out that sex carries information only together with the interaction – in the model without the interaction its effect is the average difference over the whole age range (\(b=-2.04\), \(p=0.008\)), which hides the fact that this difference grows with age.